About

Ahead of the Curve provides you with analysis and insight into today's global financial markets. The latest news and views from global stock, bond, commodity and FOREX markets are discussed. Rajveer Rawlin is a PhD and received his MBA in finance from the Cardiff Metropolitan University, Wales, UK. He is an avid market watcher having followed capital markets in the US and India since 1993. His research interests includes areas of Capital Markets, Banking, Investment Analysis and Portfolio Management and has over 20 years of experience in the above areas covering the US and Indian Markets. He has several publications in the above areas. The views expressed here are his own and should not be construed as advice to buy or sell securities.

Featured post

Time Series Analysis with GRETL

This video shows key time-series analyses techniques such as ARIMA, Granger Causality, Co-integration, and VECM performed via GRETL. Key dia...

Showing posts with label stock market crash. Show all posts

Tuesday, 20 June 2023

The Ghost of Irving Fisher Returns?

So many market cliches have been used to describe markets over the years. These include Goldlilocks, the Fed Put, irrational exuberance, don't fight the FED, don't fight the tape, etc. The aptest phrase for today's markets is the famous quote from economist Irving Fisher in October 1929 right before the Great Depression of the 1930s set in:

"Stocks have reached what looks like a permanently high plateau"

                            Source: Market Cycles Chart - New Trader U

Of course, central banks have a plethora of unconventional monetary policy tools at their disposal to avert major crises these days, but valuations are quite stretched.


Wednesday, 19 February 2020

Stretched Market Valuations?

A very interesting pic from a post from Michael Lebowitz (via Twitter) highlighting stretched market valuations. Yes you must not fight the Fed and fight the tape but things are getting way too stretched in here valuation wise:

market valuations

Tuesday, 23 July 2019

Nasdaq - Nasdaq 100 Ratio at 2000 Levels - Massive Crash Just around the Corner?

After 19 long years the Nasdaq - Nasdaq 100 Ratio has reached the record lows it saw in 2000, when a hand full of tech stocks outperformed the broader market.  This occurred at the market peak just before the dotcom bubble burst taking the Nasdaq down almost 80% and the rest of the market over 40%. This time will be no different with a massive market crash just around the corner, with all signs such as global inverted yield curves and trade wars pointing to a severe recession ahead:

nasdaq - nasdaq 100 ratio - market crash

Friday, 23 March 2018

Stock Market Panic Just Beginning?

Markets have been taking a turn for the worse on fears of a global trade war. A look at the Fear and Greed Index computed by CNNMoney shows that investor sentiment is hitting record lows:
fear and greed


However the Vix is yet to take out the February highs and suggests that there is no major panic yet:

volatility vix


Also the NYSE McClellan Summation Index (courtesy stockcharts) has just begun breaking down again following the recent rally and has more room to fall suggesting more selling ahead:

summation index


Taken together we probably are headed for more selling and panic that should take us a lot lower to the major break out zone of the S and P 500 near 2400 first before any relief rallies occur.

Wednesday, 14 February 2018

Bond Yield Spike Signaling Brand New Crisis

A very interesting chart from Marketwatch.com that shows every time bond yields tagged their long term down trend line a crisis of some proportion erupted we finally manage to pop above that line sowing the seeds for the next major crisis:
financial crisis 2018


What is interesting is as Northmantrader points out the the S and  P 500 ten year yield ratio is showing signs of a major long term top suggesting a significant asset allocation out of stocks into bonds possibly on flight to quality fears when the next crisis commences:
stock bond ratio

Wednesday, 7 February 2018

The Most Important Crowded Trade of All?

We have recently witnessed or are about to witness the implosion of a series of crowded trades namely long bitcoin, long Index ETF's and short volatility. The most important crowded trade of all is the dollar carry trade and this has been in vogue since the early 1980's. However the dollar appears to have broken out of its long term down trend line in the last 8 years post the great recession of 2008 though reluctantly so. When the real up move in the dollar occurs which is imminent look for massive carry trade liquidation and a rout in risky assets such as stocks, commodities and emerging market currencies:

Tuesday, 23 January 2018

The Indian Market in 2008 Vs The Market Today

On the 10 year anniversary of one of the greatest market crashes in India's recent history here is an interesting comparison:

Year
Nifty P/E
USD/INR
GDP
NPA's (Trillion)
2008
>  25
< 45
> 9
< 1
2018
> 27
> 63
< 7
> 6
sources: Craytheon.com, RBI

It was a runaway rally in 2008 much like it is now. We had a market peak at a P/E ratio in excess of 25 as is the case now. The major difference being the Rupee has depreciated significantly now and our GDP is much lower. Also the banking system is saddled with almost 10 times more NPA's than was the case in 2008. So if you are tempted to think "Is this time different?" Think again!

Tuesday, 12 December 2017

Bitcoin 2017 Vs Home Builders 2008 Vs Nasdaq 2000

Most periods of excessive booms end with speculative busts. The dotcom bust of 2000 produced a recession so did the housing bust of 2008. Today's poster child seems to be bitcoin. Just as the internet was here to stay back in 2000 so is block chain technology today. However crypto currencies are trading at levels suggesting they could become reserve currencies of the world replacing the dollar and that implies a reset on short order. It's never different and always the same:
speculative bubbles

Wednesday, 4 October 2017

Emerging Parallels to the Fall of 2007 - Hallmark of a Brand New Crisis

The fall of 2017 is increasingly looking like the fall of 2007 when risky assets topped out:

Sunday, 23 July 2017

S and P 500 pushing the Envelope

This is from my recent post on talkmarkets.com:

Looking at the weekly close on the S and p 500 since 1950 its average close stands at 522 while the standard deviation stands at 606. One of the few markets in the world where the standard deviation exceeds the mean. This is also true with other US Indices like the Dow and the Nasdaq but is not the case with Emerging markets. This has been the case with US markets since 1998 when the FED intervened in the market to bail out the failing LTCM. Subsequent Fed intervention has caused the risk in the market to go up and not come down.

Taking this a step further looking at where we are now we are sitting at well over 3 standard deviations over the mean. Earlier situations like this produced corrections in excess of 15%. Lets take a look at some of them:

stock market outlook 2017

S and P 500 Returns from Peak at about 3 Standard Deviations above the Mean
Time Standard Deviations above Mean %Loss from Top
August 1987 4.57 33%
July 1998 4.93 18%
March 2000 4.63 26%
May 2001 3.20 25%
October 2007 2.84 56%
July 2015 3.04 16%

This is not to say the markets will start crashing tomorrow but given the insane valuations and the fact that we have not visited the long term average on the S and P 500 which stands at 522 since 1974, the risks are out there!

Thursday, 1 December 2016

Major Sell Off Coming?

Tuesday, 4 October 2016

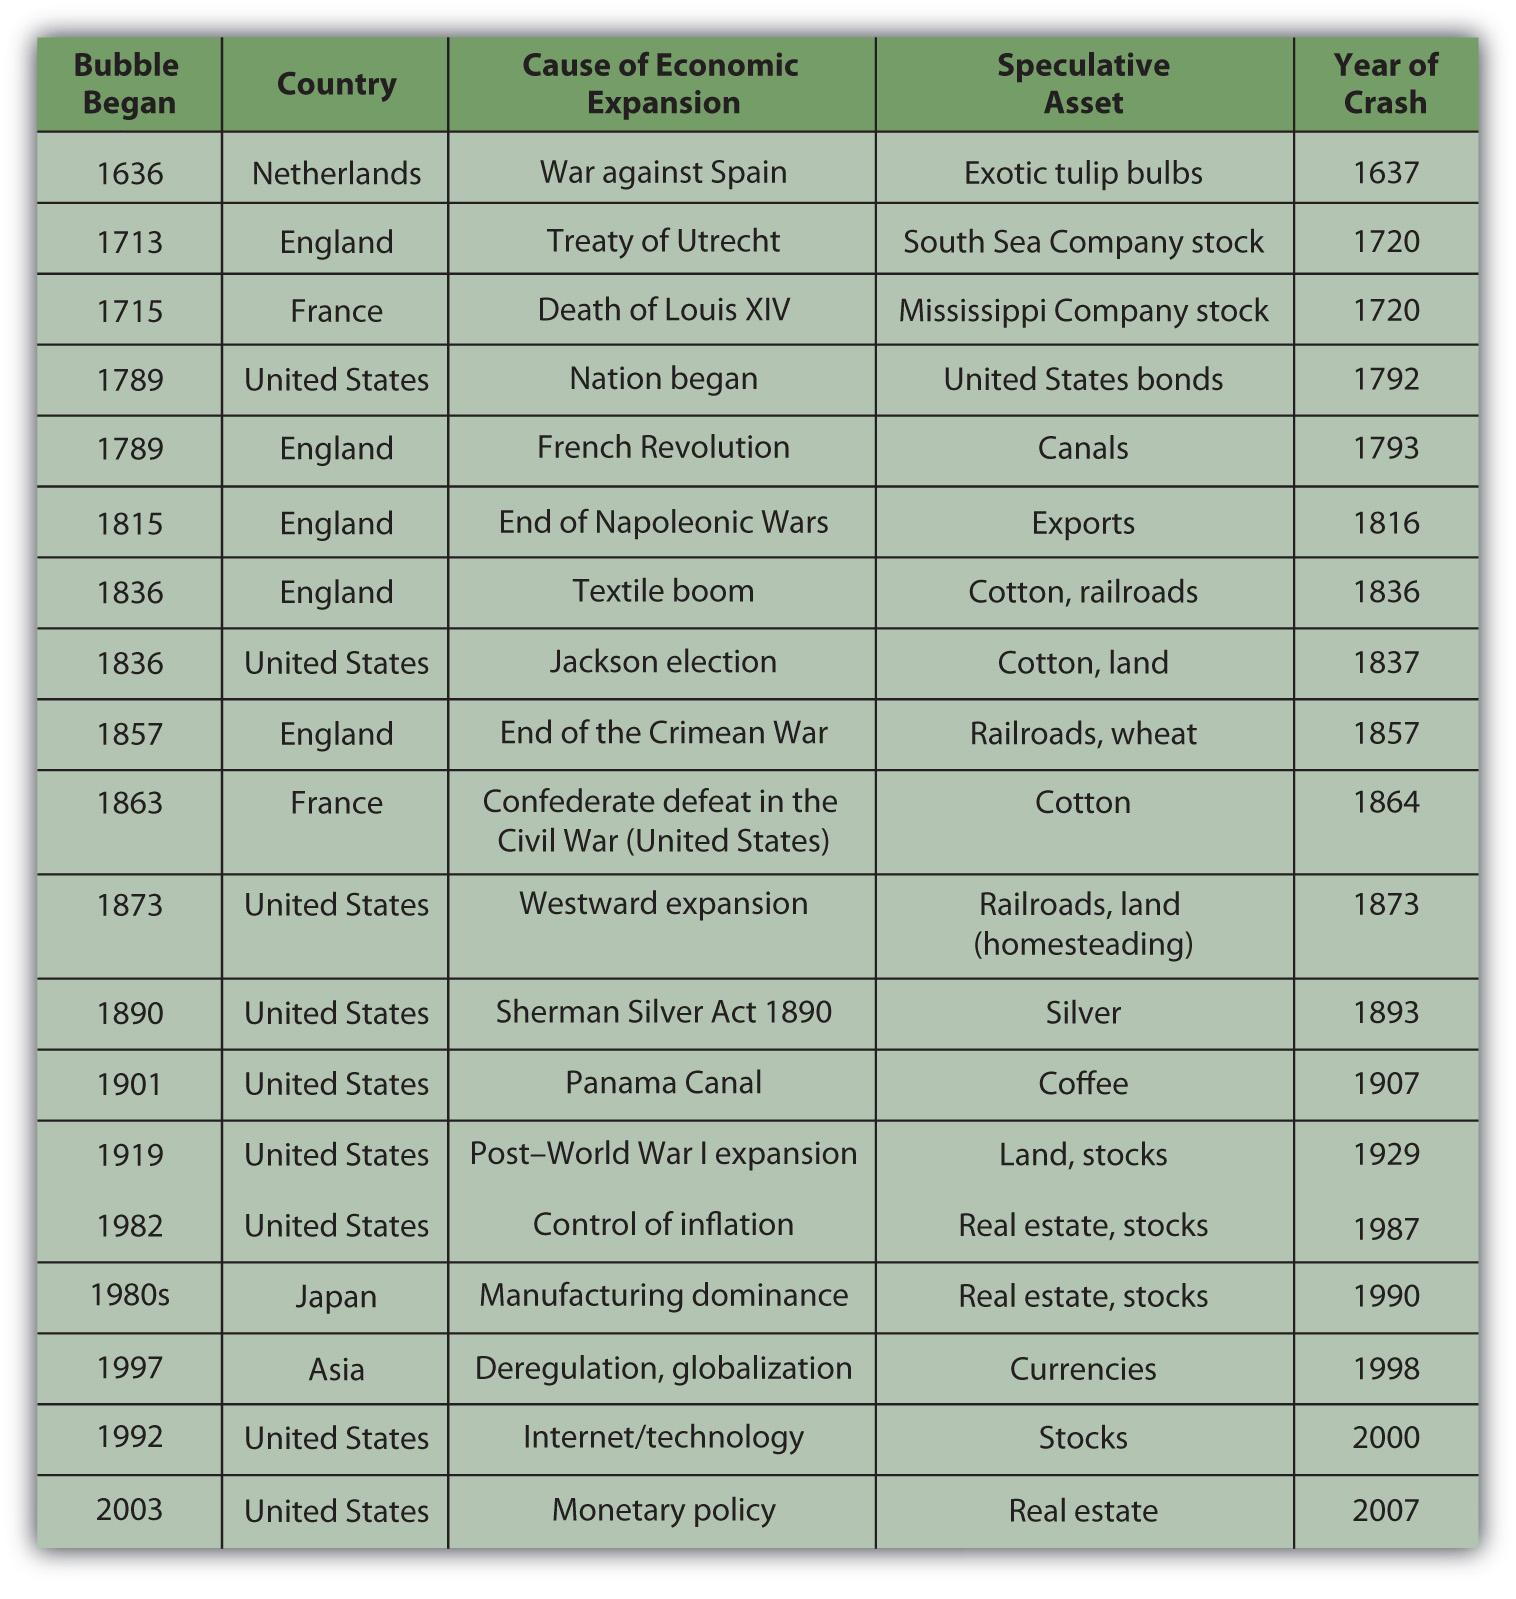
Chart of the Week - Bubbles in History

Bubbles are often created by cheap and easy money in the system. The table below is courtesy Greed & Fear via Seeking Alpha and looks at some of the most notable bubbles in history. Wonder how long is it going to take for this current global central bank engineered asset bubble to pop?
asset bubbles

Thursday, 8 September 2016

Chart of the Week - Libor Spikes Vs S & P 500

The chart of the week is courtesy Bob Hoye via SafeHaven and looks at spikes in the 3 month LIBOR rate vs S and P 500 performance. Any sustained spikes in LIBOR in excess of 25 basis points in the last year has often resulted in significant stock market pull backs as seen in August 2015 and February 2016. There is usually a lag of about 2 months for the sell off to occur. We had a recent LIBOR spike about 2 months ago and should see a stock market pull back soon. More importantly LIBOR has entered a clear uptrend this past year and that is problematic for risk assets long term:

Libor 2015-2016

Sunday, 4 September 2016

Another Economic Collapse Round the Corner?

Is an economic collapse coming? Will precious metals offer a safe haven? Some interesting perspective from Milesfranklin.com

Wednesday, 31 August 2016

Chart of the Week - BOJ Stock Market Casino

The chart of the week is courtesy Doug Wakefield via Safe Haven and shows that the Bank of Japan (BOJ) is a top 10 share holder in about 90% of the Nikkei 225. This after the Nikkei has been down nearly 60% since its highs in 1989. After multiple QE's that have failed to stimulate the economy and get rid of the deflationary negative interest rate scenario in Japan, this latest move by the BOJ has failure written all over it. Another down move in the Nikkei from a strengthening Yen could prove to be problematic for the BOJ going forward.

BOJ is Top 10 Shareholder in about 90% of Nikkei 225

Wednesday, 17 August 2016

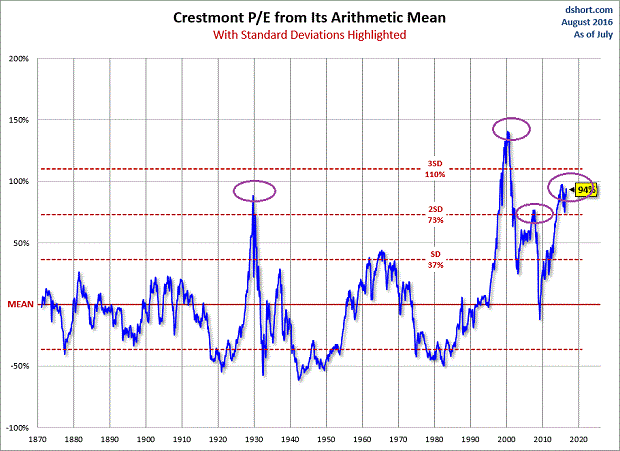
Chart of the Week - Cresmont P/E

The Chart of the week is courtesy Gary Gordon via seeking alpha  and shows the Cresmont P/E ratio of the S & P 500. The ratio is currently at well over 2 standard deviations over the mean much like in 1930, 2000, and 2008 when the market experienced substantial sell offs. Will it be any different this time around?

Crestmont-PE-arithmetic-mean

Sunday, 7 August 2016

Disecting the Recent Trump Warning on the Stock Market

Donald Trump recently issued a warning on the stock market suggesting a collapse is imminent. Here is some analysis of those views from the The Dollar Vigilante:

Friday, 1 July 2016

Rotation out of Stocks into Gold Upcoming?

Upcoming stock market panic to push gold to new highs? Here is an interesting view from our partners at the The WallStreet Window:


Stock Market Meltdown Likely to Drive Gold Towards $1,500 - Mike Swanson

I'm sure you are well aware of the big stock market drop that hit the US stock market on Friday as the DOW fell over 600 points following the UK BREXIT vote. Almost every sector of the stock market fell except for gold and Treasury bonds.I believe that what we saw on Friday was the simple start of a big drop that is going to turn into a total stock market meltdown in the coming weeks. In fact the whole drop may not end for a few months.

I know that might be hard to believe or accept, because very few people are saying that people should sell or be worried. A big problem in the stock market world is that when you tell people to sell many simply get angry at you. No one wants to be told to sell. Few people will listen and if you tell people to sell and things go up they will crucify you.This puts investment advisors and stock brokers in a bad spot.

If they encourage their clients to sell and the stock market goes up they are likely to see their clients go elsewhere. If things fall all of the other brokers and advisors are keeping their clients in so they can just say oh well or come up with reasons to hold and hope.So no one has anything to gain by getting people out of the stock market and everything to lose by doing so.

People have been sold a dream by the financial media and investment industry that all they have to do is put money into the stock market and do no thinking and no work and get rich one day.
But that is not how the real world works.

Unless someone wins the lottery by being lucky to own a stock that goes up for decades on end like buying Apple at $1.00 they are not going to get rich by doing no work in the stock market. You have to think and make changes from time to time in the investment game and most people just don't want to do that.

Stock market drops happen. You saw one in 2008 and in 2000 and this drop will eliminate the margin player and lazy bubble bull when it is done.And here is a secret. The world bankers and elites that rule the global financial system are not in charge of some control conspiracy causing crashes. Instead they are totally nihilistic and create situations that lead to disaster.

All they have done is kept things afloat since 2008 while their friends could make money in more stock market games and bank loans. So there is no real recovery just another rip-off. Oh I'm sure they hoped their policies would eventually lead to economic growth and a good world for everyone, but that didn't happen. They got lots of people to believe them who wanted the markets to go up forever again so they could sit there watching TV do nothing and get rich and Clinton is in their pocket.

Gold is acting as a safe haven as money is coming out of world currencies and stock markets across the globe into "safety trades" and some of that money is flowing into gold, silver, and mining stocks.
I know there is a stock market gap up this morning, but at the rate gold went up on Friday and Monday and that the US stock market is falling I believe that gold will approach $1,500 an ounce before this stock market drop ends.

On Friday on CNBC I heard several people say that they were looking for the market to have a bad day Monday and that they might then buy on Tuesday. Everyone was looking for the UK to vote to stay in the Euro too! But the scenario many were talking about over the weekend was for a bad Monday that would lead to a big gap down Tuesday that would be the bottom.

So they were looking to buy a gap down today, but instead the market is gapping up.
I have no doubt there will be people thinking that this MUST go up now and will try to chase the gap up when in my view they should be selling! No one is really worried about the markets and I think most people have no clue how serious things are.

If you would look through all of the S&P 500 stocks and just ask yourself how many of them are in a position to make a new high and rally beyond it you would see how messed up the stock market is.
Incredibly I still have yet to receive ONE SINGLE email from ONE SINGLE person thinking about selling or expressing any worries at all since the Thursday vote.It's amazing.

I think today with so much ETF trading that so many people only watch ETF's and do not know what is happening to the stocks that make them up so they are unable to grasp what is happening.
Stock market bottoms and even the end of corrections tend to come when there is panic in the markets and people sell-out on a bottom or buy so many puts to hedge their positions that the volatility premiums on the puts explode.

I have no idea if the market will go up all day on Tuesday or not and do not really care.
Most gap downs get sold, but I cannot predict what the market will do hour by hour or how it might end up on Tuesday's close, but I can tell you that there is no way in the world I believe we are near a bottom no matter what the stock market does today.Let me give you two of the simple reasons why.
First of all look at this chart:
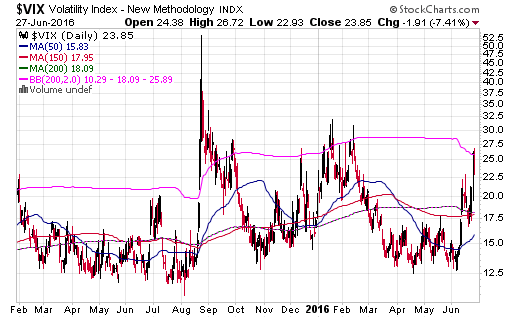
vix 1


The VIX measures the premium options players are paying for volatility and goes up when they get scared. In August the VIX went over 40 and in January it went above 30. Moves to 30 often mark the end of stock market declines.

Incredibly on Monday the S&P 500 fell 36 points to close on 2000 way below its 200-day moving average and the VIX fell too! That meant that people were not scared at all as the market fell on Monday. If they were scared the VIX would have gone up instead of down! In fact many people were trying to buy the bottom or looking for signs of one.

I do not think this drop will end until the VIX goes over 30 and it probably will not end until it goes over 40! And maybe even 50!Why? Friday's action is a big clue to what is coming:
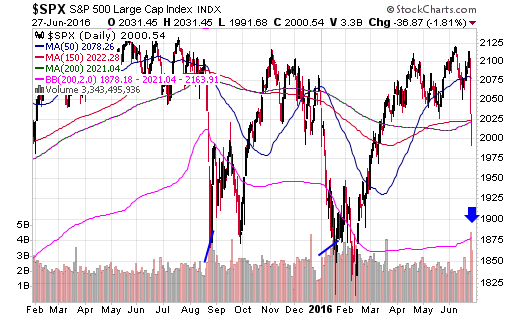
s and p 500


I want you to notice how huge the volume was on Friday. When you get a correction typically the volume expands once you get to the end of it as people go into pure panic selling mode.
In fact usually the biggest volume day during a decline is the day of the end of it. So on Friday we had massive volume at the start of the market drop and a big 600 point plus down day in the DOW.

That makes me conclude that when the market does finally put in a bottom that the volume will be even greater than it was on Friday and that the DOW will be down over 600 points during the day when it comes.And that means we are heading for a nightmare meltdown.

So when you think of where things are going and see how gold is acting as a safe haven it is not hard to project gold going to $1,500 during this stock market decline. Really gold started a new bull market this year and will go up much higher than that in the years to come, but a move to $1,500 seems doable now this summer.

We will get pauses on the way down for the US stock market such as today and it may take the market weeks or even a few months to finally bottom. Many people are fully invested in the stock market or on margin even. I fear that they are going to end up wiping themselves out on this decline.
Such people should reduce their risks and do some selling now instead of being forced to later.

The big stock market gap downs we saw in the past two trading sessions has trapped people in the market. What happens on a sudden big gap down to people that are invested in a market is that they do not want to sell on a big down opening so they hold and hope for a bounce. If the market just goes up a little off of the opening and then back down on the close they get screwed, but go into denial and hope a bounce will come tomorrow.

They look for support at hope levels.With the S&P 500, DOW, and Nasdaq all below their 200-day moving averages support levels are really imaginary and can only provide pause periods. The real bottom now will come in panic selling, not with some magic support robot buy. And it's lining up to be a massive and frightening day of panic when it comes. I know it's hard to think that way when the market is gapping up in the morning.

I have told friends of mine to step out of the way of the train and do not try to be a hero here.
And I have been telling them to buy gold and silver, but most American investors are starting to get hurt because all they own are US stock funds and I do not want them to get killed. They must step aside. They must save themselves! They need to have money in gold!

This is phase one of what I think is going to be a two phase cycle that will last for three to five years.
The first phase is a fast and furious stock market meltdown for a few months. BREXIT is not the cause of it, but it was the trigger. All BREXIT did was make an unstable situation in the financial market break like making cracks form in a dam.

The water is starting to leak out now.The second phase will mean totally skyrocketing gold prices.
Keep your crash helmet on! Do not take it off and if you do not have one make one for yourself!
I want you to survive this stock market drop. There is big money to be made in the coming years, but you must survive this current stock market meltdown to take advantage of it!

Ok you may not believe me and you may simply not want to believe me. Then here is what you need to watch for. If the market is fine like they say then it will go up! If it is not fine then it will end up going back down. It's as simple as that. So if you are afraid of taking advantage of a gap up to do some selling then you can wait to see if the market goes through Monday's low in the coming days.
If the bulls are right then the S&P 500 won't do that.

If it does that then you know bigger selling is coming and can get out. I cannot give you individual advice and you should talk to your investment advisor, but if it was me and I was fully invested in the US stock market and not diversified properly (junk bonds are no help here!) then I would either sell on the gap up or just sell when the S&P 500 goes through 1990 or opens below it. I would also own gold as I do own gold among other things!

For more on this visit our partner Michael Swanson on his website www.wallstreetwindow.com.

Thursday, 26 May 2016

Interesting Jim Rogers Interview

A very interesting interview that legendary investor Jim Rogers did recently where he discusses an imminent global recession:

Friday, 20 May 2016

Fed Unlikely to Raise Rates, Implications for Gold

An interesting post from our partners at the The WallStreet Window:

Is the fed going to raise rates in June? Think again. A no raise has bullish implications for gold.


The Fed and Gold from Rajveer Rawlin

For more on this visit our partner Michael Swanson on his website www.wallstreetwindow.com.

World Indices


Live World Indices are powered by Investing.com

Market Insight

My Favorite Books

  • The Intelligent Investor
  • Liars Poker
  • One up on Wall Street
  • Beating the Street
  • Remniscience of a stock operator

See Our Pins

Trading Ideas

Forex Insight

Economic Calendar

Economic Calendar >> Add to your site

India Market Insight

My Asset Allocation Strategy (Indian Market)

Cash - 40%
Bonds - 20%
Fixed deposit - 20%
Gold - 5%
Stocks - 10% ( Majority of this in dividend funds)
Other Asset Classes - 5%

My belief is that stocks are relatively overvalued compared to bonds and attractive buying opportunities can come along after 1-2 years. In a deflationary scenario no asset class does well other than U.S bonds, the U.S dollar and the Japanese yen, so better to be safe than sorry with high quality government bonds and fixed deposits. Cash is the king always. Of course this varies with the person's age.