On the 10 year anniversary of one of the greatest market crashes in India's recent history here is an interesting comparison:
sources: Craytheon.com, RBI
Year
|
Nifty P/E
|
USD/INR
|
GDP
|
NPA's (Trillion)
|
2008
|
> 25
|
< 45
|
> 9
|
< 1
|
2018
|
> 27
|
> 63
|
< 7
|
> 6
|
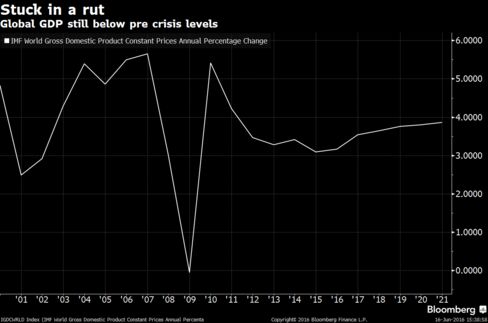
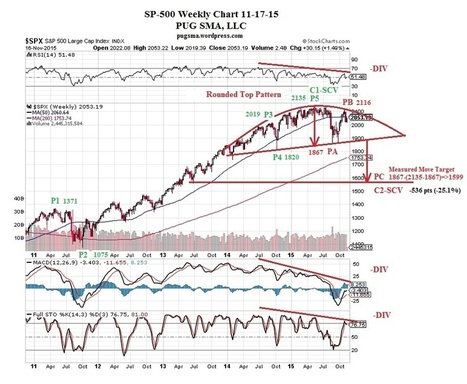
It was a runaway rally in 2008 much like it is now. We had a market peak at a P/E ratio in excess of 25 as is the case now. The major difference being the Rupee has depreciated significantly now and our GDP is much lower. Also the banking system is saddled with almost 10 times more NPA's than was the case in 2008. So if you are tempted to think "Is this time different?" Think again!


2) Keeping An Open Mind About The U.S. Stock Market
3) Watch these 3 charts when the Fed makes a rate move
4) This chart warns that stock market investors should be on high alert
5) 3 Numbers: Eurozone deflation risk receding, but only slightly
6) The GDP In Charts: Deflation Helps Indian Economy Grow 7.4% But Nominal Growth at 6%