About

Ahead of the Curve provides you with analysis and insight into today's global financial markets. The latest news and views from global stock, bond, commodity and FOREX markets are discussed. Rajveer Rawlin is a PhD and received his MBA in finance from the Cardiff Metropolitan University, Wales, UK. He is an avid market watcher having followed capital markets in the US and India since 1993. His research interests includes areas of Capital Markets, Banking, Investment Analysis and Portfolio Management and has over 20 years of experience in the above areas covering the US and Indian Markets. He has several publications in the above areas. The views expressed here are his own and should not be construed as advice to buy or sell securities.

Featured post

Time Series Analysis with GRETL

This video shows key time-series analyses techniques such as ARIMA, Granger Causality, Co-integration, and VECM performed via GRETL. Key dia...

Showing posts with label fed. Show all posts

Thursday, 16 August 2018

Why a Massive Selloff in Risk Assets Could be Just a Few Days Away?

First market breadth is diverging with the New 52 week high low indicator not confirming the recent retest of highs in the S and P 500:

S&P 500 vs S&P 500 Stocks at 52-Wk Highs Minus Lows (S&P 500 NH-NL)

High beta segment of the market such as the Nasdaq is beginning to under perform the broader market much like in 2000:

S&P 500 vs Nasdaq Relative to its 200-Day Moving Average (Nasdaq R200)

The Skew Vix ratio as shown on stockcharts has spiked into double digits recently suggesting high tail risk, which is often a precursor to rising volatility and a risk off trade set up:

skew vix ratio


All this as we are in the middle of an emerging market currency crisis much like in 1998 unsupported by a tightening FED:

Wednesday, 2 May 2018

Daily Market Insight

Here is your daily market insight from some of the best asset managers, financial analysts and CMT's of today:

Tuesday, 19 December 2017

FED Balance Sheet Vs Emerging Market Volatility Vs Stock Market Capitalization to GDP

The assets on the FED balance sheet stands at well over 4.4 trillion dollars, this has coincided with record low emerging market volatility and highly inflated levels of stock market capitalization to GDP globally. With the FED beginning a slow tapering process, some sort of mean reversal is on the cards which could result in an uptick in emerging market volatility and a pull back of some sort in global stock market indices:

Wednesday, 6 December 2017

Yield Curve about to Invert?

The spread between 10 year US bonds and 2 year US bonds is currently at 5 year lows and will likely go negative post the fed rate hike next week. This would most likely cause the US yield curve to eventually invert and is a harbinger of a decelerating/recessionary economy going forward. Will tax cuts save the day? I doubt it.

Thursday, 8 December 2016

Gold - The Then and Now

Gold prices have been incredibly volatile this year and are currently near the middle of the observed range in 2016 near $ 1175/ Ounce having started the year close to $1075 / Ounce and trading as high as $1375 / Ounce during the course of the year. Gold often benefits from increased liquidity in the financial system and has been traditionally viewed as a hedge against inflation. Gold also tends to have a safe haven status and tends to benefit during financial crises when Central Banks flood the world with liquidity. So thinking ahead lets take a look at what is in store for Gold prices?

To do this let us look at the historical performance of Gold since the Great Recession of 2008. Three years after the start of the Bernanke Fed's quantitative easing program in the United States, gold prices reached a high we've still yet to see again as this gold chart based on events that affected the price of gold and gold IRAs over the past few years since the Financial Collapse of 2008 shows. Recovering back from its January 2016 low by March, another peak in May before reaching July's high of around $1387 per ounce so far this year for GCG7 (February Gold Futures) traded on CME and Eurex exchanges looks a bit short-lived, given today's February Gold Futures price of $1173 as on December 8 2016.
gold performance chart time line

As can be seen above Gold surged sharply higher between 2008 and 2011 following Quantitative easing (QE) embarked by central banks across the globe. The gold price well over doubled from reaching as high as $1975 in August 2011. From there Gold endured a sharp correcting falling over 40% and reaching the $1050 mark in December 2015 following the first FED rate hike and the end of QE. With no further FED hikes forth coming Gold resumed its upswing reaching a high of $1387 following Brexit. However following the Trump win in the US presidential election Gold has sold off yet again on prospects of reflation, a strong Dollar and an upcoming FED hike.

With the FED taking center stage yet again It would be interesting to see if the sell off in Gold continues on a strengthening Dollar from a possible FED hike or Would gold become a safe haven play yet again much like in December 2015 and benefit from capital outflows from risky assets like stocks and emerging market currencies?

Thursday, 1 December 2016

Daily Forex Insight

Here are some insights from the currency strategists at dailyfx. They cover the fundamentals and technicals of key Forex pairs and other key markets along with some of the key economic news of the day. Today's commentary looks at the Euro ahead of the payroll data out of the US:

Wednesday, 30 November 2016

Daily Forex Insight

Here are some insights from the currency strategists at dailyfx. They cover the fundamentals and technicals of key Forex pairs and other key markets along with some of the key economic news of the day. Today's commentary looks at whether the big market moves in November are here to stay:

Tuesday, 29 November 2016

Daily Forex Insight

Here are some insights from the currency strategists at dailyfx. They cover the fundamentals and technicals of key Forex pairs and other key markets along with some of the key economic news of the day. Today's commentary looks at oil and the Canadian Dollar ahead of the OPEC meeting:

Monday, 28 November 2016

Daily Forex Insight

Here are some insights from the currency strategists at dailyfx. They cover the fundamentals and technicals of key Forex pairs and other key markets along with some of the key economic news of the day. Today's commentary looks at the macro themes in play this week:

Sunday, 27 November 2016

Daily Forex Insight

Here are some insights from the currency strategists at dailyfx. They cover the fundamentals and technicals of key Forex pairs and other key markets along with some of the key economic news of the day. Today's commentary looks at the key economic reports ahead this week like the payroll data out of the US:

Wednesday, 23 November 2016

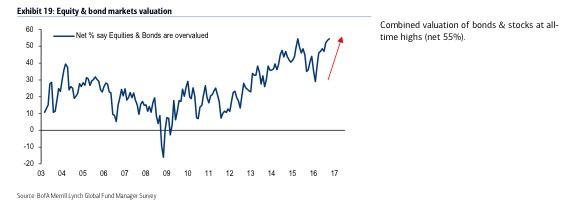
Chart of the Week - Combined Valuation of Equities and Bonds

The chart of the Week is courtesy Seventeen Mile via Seeking Alpha and shows the combined value of stocks and bonds since 2003. Thanks to the FED engineered asset bubble the combined valuation is testing all time highs made in 2015 prior to a 15% sell off in the S and P 500. Recently bonds have endured a significant and sharp sell off. Equities are likely to follow suit.
valuation

Tuesday, 22 November 2016

Daily Forex Insight

Here are some insights from the currency strategists at dailyfx. They cover the fundamentals and technicals of key Forex pairs and other key markets along with some of the key economic news of the day. Today's commentary looks at the key trends that are likely to play out for the rest of the year:

Monday, 21 November 2016

Daily Forex Insight

Here are some insights from the currency strategists at dailyfx. They cover the fundamentals and technicals of key Forex pairs and other key markets along with some of the key economic news of the day. Today's commentary looks at the surging dollar and the S & P 500:

Friday, 18 November 2016

Daily Forex Insight

Here are some insights from the currency strategists at dailyfx. They cover the fundamentals and technicals of key Forex pairs and other key markets along with some of the key economic news of the day. Today's commentary looks at some key Forex pairs:

Wednesday, 16 November 2016

Daily Forex Insight

Here are some insights from the currency strategists at dailyfx. They cover the fundamentals and technicals of key Forex pairs and other key markets along with some of the key economic news of the day. Today's commentary looks at FED rate hike speculation in December:

Friday, 11 November 2016

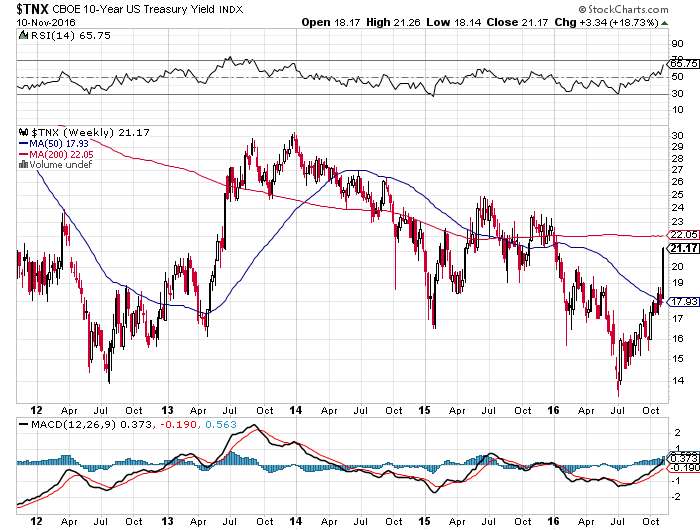
Chart of the Week - Surging Bond Yields

The chart of the week is from StockCharts.com and shows the 10 year US bond yield:

Bond Yield
It shows bond yields breaking out of long term resistance levels. Bond yields have surged over 50 basis points this month alone. Surging bond yields are triggers for major capitol outflows from risk assets and emerging markets. Recent instances of this were the taper tantrum at the end of QE3 and the 25 basis points hike by the FED last year both of which sent global markets down well over 15%. The FED is incidentally way behind the curve here and the market has already raised rates for the FED.

Thursday, 20 October 2016

Chart of the Week - Balance Sheet of the US Federal Reserve

The chart of the week is courtesy Charles Hugh Smith and shows the current balance sheet of the FED. The current balance sheet show a total asset base exceeding 4.5 Trillion dollars thanks to a series of quantitative easing (QE). This is up from the 1.0 Trillion mark in 2008 when the FED flooded the world with cheap money via its unconventional monetary policy. Wonder how long this continues?
US FED balance sheet

Wednesday, 21 September 2016

Daily Forex Insight

Here are some insights from the currency strategists at dailyfx. They cover the fundamentals and technicals of key Forex pairs and other key markets along with some of the key economic news of the day. Today's commentary looks at markets post key monetary policy decisions from the BOJ and the FED:

Wednesday, 15 June 2016

Brexit is Official - Big Downside Ahead

We now know the Fed is on hold for the foreseeable future. Markets are now focusing on Brexit. The referendum has gone decisively in favor of a Brexit. This is all set to rock risk assets with some significant downside. A set up very similar to August 2015 and January 2016 is developing. Lets look at some key drivers:

1) The Vix:

Volatility has begin to surge yet again with the Vix eclipsing the 20 mark. The Vix has not made new lows with each of the recent highs in the S and P 500 and could eclipse its February highs soon:

2) The Yen:

The Yen has just made new highs for 2016 and is looking to head to the 100 mark as risk aversion and carry trade liquidation become the game in town:

3) Gold:

Gold is also benefiting from its safe haven status as paper assets go out of favor. Gold is sitting very close to its 2016 highs:

4) Commodities:

Economically sensitive commodities like copper and oil have resumed major break downs and are likely to head much lower as global economic weakness takes center stage:

5) Stock Markets:

European markets are already sporting big break downs along with emerging markets and the trend is likely to continue and spread to markets in the US and else where:

Friday, 20 May 2016

Fed Unlikely to Raise Rates, Implications for Gold

An interesting post from our partners at the The WallStreet Window:

Is the fed going to raise rates in June? Think again. A no raise has bullish implications for gold.


The Fed and Gold from Rajveer Rawlin

For more on this visit our partner Michael Swanson on his website www.wallstreetwindow.com.

World Indices


Live World Indices are powered by Investing.com

Market Insight

My Favorite Books

  • The Intelligent Investor
  • Liars Poker
  • One up on Wall Street
  • Beating the Street
  • Remniscience of a stock operator

See Our Pins

Trading Ideas

Forex Insight

Economic Calendar

Economic Calendar >> Add to your site

India Market Insight

My Asset Allocation Strategy (Indian Market)

Cash - 40%
Bonds - 20%
Fixed deposit - 20%
Gold - 5%
Stocks - 10% ( Majority of this in dividend funds)
Other Asset Classes - 5%

My belief is that stocks are relatively overvalued compared to bonds and attractive buying opportunities can come along after 1-2 years. In a deflationary scenario no asset class does well other than U.S bonds, the U.S dollar and the Japanese yen, so better to be safe than sorry with high quality government bonds and fixed deposits. Cash is the king always. Of course this varies with the person's age.