Indicator
|
Weekly
Level / Change / Significance
|
Implication
for
S
& P 500
|
Implication
for Nifty*
|
S
& P 500
|
1940, 1.75%
|
Bullish
|
Bullish
|
Nifty
|
7564, 1.90%
|
Neutral**
|
Bullish
|
China
Shanghai Index
|
2738, -6.14%
|
Bearish
|
Bearish
|
Gold
|
1118, 1.84%
|
Bullish
|
Bullish
|
WTIC
Crude
|
33.74, 4.62%
|
Bullish
|
Bullish
|
Copper
|
2.06, 2.90%
|
Bullish
|
Bullish
|
Baltic
Dry Index
|
317, -10.45%
|
Bearish
|
Bearish
|
Euro
|
1.083, -0.35%
|
Neutral
|
Neutral
|
Dollar/Yen
|
121.05, 1.93%
|
Bullish
|
Bullish
|
Dow
Transports
|
6907, 1.89%
|
Bullish
|
Bullish
|
High
Yield (ETF)
|
33.21, 0.76%
|
Bullish
|
Bullish
|
US
10 year Bond Yield
|
1.93%, -5.71%
|
Bullish
|
Bullish
|
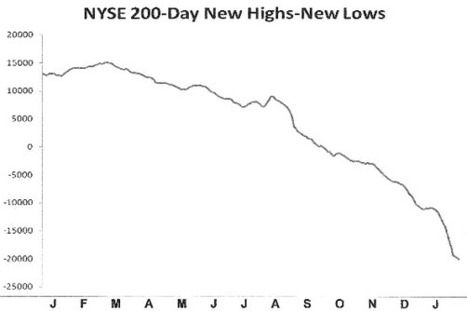
Nyse
Summation Index
|
-725, 5.82%
|
Bullish
|
Neutral
|
US
Vix
|
20.20, -9.58%
|
Bullish
|
Bullish
|
20
DMA, S and P 500
|
1925, Above
|
Bullish
|
Neutral
|
50
DMA, S and P 500
|
2008, Below
|
Bearish
|
Neutral
|
200
DMA, S and P 500
|
2046, Below
|
Bearish
|
Neutral
|
20
DMA, Nifty
|
7536, Above
|
Neutral
|
Bullish
|
50
DMA, Nifty
|
7705, Below
|
Neutral
|
Bearish
|
200
DMA, Nifty
|
8088, Below
|
Neutral
|
Bearish
|
India
Vix
|
17.24, -8.40%
|
Neutral
|
Bullish
|
Dollar/Rupee
|
67.88, 0.44%
|
Neutral
|
Neutral
|
Overall
|
S
& P 500
|
Nifty
|
|
Bullish
Indications
|
11
|
12
|
|
Bearish
Indications
|
4
|
5
|
|
Outlook
|
Bullish
|
Bullish
|
|
Observation
|
The
Sand P 500 and the Nifty rallied last week on what will prove to be yet
another failed. QE from Japan. Indicators are bullish. Looking for the current
bounce to hit overhead resistance at slightly higher levels.
|
||
On
the Horizon
|
Australia–
Rate decision, Canada – Employment
data, China-PMI, New Zealand – Employment data, Euro zone – German Employment
data, U.K – Rate decision, U.S – Employment data, ISM data, India - Rate decision.
|
||
*Nifty
|
India’s
Benchmark Stock Market Index
|
||
Raw
Data
|
Courtesy
Google finance, Stock charts, FXCM
|
||
**Neutral
|
Changes less than 0.5% are considered
neutral
|
The US
market and Nifty rallied last week as expected. Signals are bullish for the
upcoming week. The markets are in crash mode and are likely to continue major
breakdowns in 2016 after this oversold bounce hits resistance near the 1980
mark on the S&P. The critical levels to watch are 1960 (up) and 1920
(down) on the S & P and 7600 (up) and 7500 (down) on the Nifty. A
significant breach of the above levels could trigger the next big move in the above
markets. You can check out last week’s report for a comparison. You can also check out snapshots of
the