About

Ahead of the Curve provides you with analysis and insight into today's global financial markets. The latest news and views from global stock, bond, commodity and FOREX markets are discussed. Rajveer Rawlin is a PhD and received his MBA in finance from the Cardiff Metropolitan University, Wales, UK. He is an avid market watcher having followed capital markets in the US and India since 1993. His research interests includes areas of Capital Markets, Banking, Investment Analysis and Portfolio Management and has over 20 years of experience in the above areas covering the US and Indian Markets. He has several publications in the above areas. The views expressed here are his own and should not be construed as advice to buy or sell securities.

Featured post

Time Series Analysis with GRETL

This video shows key time-series analyses techniques such as ARIMA, Granger Causality, Co-integration, and VECM performed via GRETL. Key dia...

Thursday 31 December 2015

Update on Those Predictions for 2015

At the beginning of 2015 I made some predictions for grins. Here's how they played out:
The original post containing the predictions can be found here


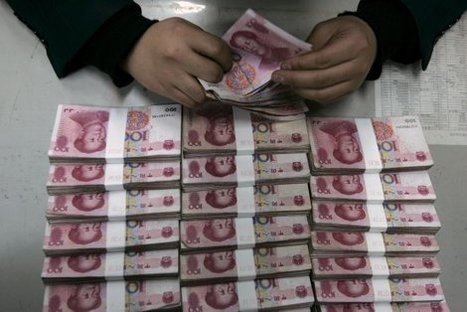
1) Dollar strength continues after a brief pause against all major currencies except the yen. With the Euro decisively breaking the long term support of 1.20.
This indeed was the year of dollar strength with the Euro below 1.10 and the trend may continue well into 2016.

2) Yen strength should result in a bout of carry trade liquidation that is a major negative for risk assets such as emerging market currencies and commodities.
While the dollar was broadly strong against the yen, the Yen was relatively strong against most other majors and 2016 promised to be year of Yen strength. This year saw a massive down move in commodities as expected.

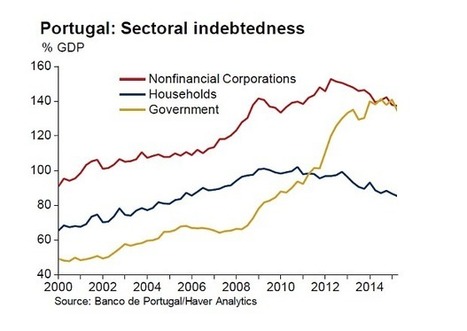
3) Despite slowing growth in most emerging economies, policy makers have their hands tied and spend a whole lot of resources defending their weak currencies unsuccessfully with higher interest rates.
Emerging market currencies saw major take downs ( The Real & Rand being notable examples) across the board and the trend is set to continue in 2016.

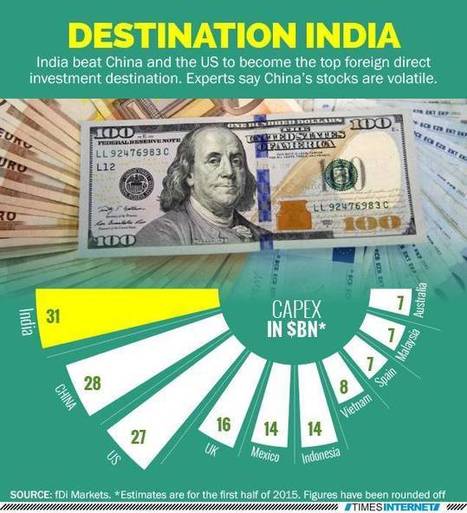
4) This in turn sparks a major exodus of FII money flows out of emerging economies like the BRIC countries which causes their stock markets to significantly under perform despite their terrific performance in 2014 and greedy analysts calls for more.
BRIC stock markets under performed significantly in 2015 except China and more weakness is likely in 2016.

5) Volatility surges in 2015 as the Vix index doubles following a major take down of stock market indices across the globe.
The Vix crossed 50 briefly in August before retreating. A big up move in the Vix is likely in 2016.

6) Risk free assets will be among the safer bets in 2015 as risk appetites significantly wanes with treasury yields continuing to plummet with QE forever still continuing but without the desired outcomes.
Risk free assets outperformed risky assets globally but US long term yields rose as the FED began tightening Monetary policy. Risky free assets will continue to outperform in 2016.

Happy New Year!

Sunday 27 December 2015

Market Signals for the US stock market S and P 500 Index and Indian Stock Market Nifty Index for the Week beginning December 28

Indicator
Weekly Level / Change / Significance
Implication for
S & P 500
Implication for Nifty*
S & P 500
2061, 2.76%
Bullish
Bullish
Nifty
7861, 1.28%
Neutral**
Bullish
China Shanghai Index
3613, 0.94%
Bullish
Bullish
Gold
1076, 0.96%
Bullish
Bullish
WTIC Crude
38.12, 6.39%
Bullish
Bullish
Copper
2.12, 0.64%
Bullish
Bullish
Baltic Dry Index
478, 0.21%
Neutral
Neutral
Euro
1.0965, 0.89%
Bullish
Bullish
Dollar/Yen
120.28, -0.78%
Bearish
Bearish
Dow Transports
7623, 3.51%
Bullish
Bullish
High Yield (ETF)
34.06, 1.40%
Bullish
Bullish
US 10 year Bond Yield
2.24%, 2.00%
Bearish
Bearish
Nyse Summation Index
-137, 43.89%
Bullish
Neutral
US Vix
15.74, -23.96%
Bullish
Bullish
20 DMA, S and P 500
2056, Above
Bullish
Neutral
50 DMA, S and P 500
2065, Below
Bearish
Neutral
200 DMA, S and P 500
2062, Below
Bearish
Neutral
20 DMA, Nifty
7792, Above
Neutral
Bullish
50 DMA, Nifty
7928, Below
Neutral
Bearish
200 DMA, Nifty
8212, Below
Neutral
Bearish
India Vix
13.74, -5.16%
Neutral
Bullish
Dollar/Rupee
65.95, -0.54%
Neutral
Bullish


Overall


S & P 500


Nifty

Bullish Indications

11

12
Bearish Indications
4
4
Outlook
Bullish
Bullish
Observation
The Sand P 500 and the Nifty were up last week. Indicators are bullish. Markets are back at resistance and the Vix is signaling complacency.
On the Horizon
China-PMI.
*Nifty
India’s Benchmark Stock Market Index
Raw Data
Courtesy Google finance, Stock charts, FXCM
**Neutral
Changes less than 0.5% are considered neutral


The US market the Nifty rallied last week. Signals are bullish for the upcoming week. The markets are back at resistance and are likely to correct with most emerging markets, and commodities already breaking down on a strong dollar and a hawkish FED.  The critical levels to watch are 2080 (up) and 2050 (down) on the S & P and 7900 (up) and 7800 (down) on the Nifty. A significant breach of the above levels could trigger the next big move in the above markets. You can check out last week’s report for a comparison. You can also check out snapshots of the S and P 500 and Nifty Indices. Love your thoughts and feedback.

Friday 25 December 2015

Interesting Market News and Views from Global Financial Markets-12

1) The Rate Hike Stock Market Crash Has Thrown Gasoline Onto An Already Raging Global Financial Inferno

If the stock market crash of last Thursday and Friday had all happened on one day, it would have been the 7th largest single day decline in U.S. history.

2) Portugal's anti-austerity Left take power in watershed moment for the euro

AEP: The president threatened to sack the new government if it
challenges the EU's Fiscal Compact, deemed a formula for economic depression
by Keynesians

3) India pips US, China as No. 1 foreign direct investment destination - Times of India

India rises 16 places in Ranking Of Competitiveness

4) Buy the ETF, Not the Mutual Fund

On Dec. 10, Third Avenue Focused Credit Fund suspended its investors’ right to ask for their money back whenever they wish. That drastic step wasn’t unprecedented, however.

5) 2016: Why the bull market in stocks isn't dead yet

The U.S. stock market faces lots of threats in 2016. But market pros polled by CNNMoney think Wall Street will claw its way past these obstacles to reach new heights.

6) China to Extend Yuan’s Trading Hours, Widening Currency’s Appeal

China’s central bank, the PBOC, said it would increase the yuan’s trading day by seven hours, opening the currency to more foreign investors and narrowing the gap between the onshore and offshore foreign-exchange markets.

Stock Market News

Amazon Deals

World Indices


Live World Indices are powered by Investing.com

Market Insight

My Favorite Books

  • The Intelligent Investor
  • Liars Poker
  • One up on Wall Street
  • Beating the Street
  • Remniscience of a stock operator

See Our Pins

Trading Ideas

Forex Insight

Economic Calendar

Economic Calendar >> Add to your site

India Market Insight

My Asset Allocation Strategy (Indian Market)

Cash - 40%
Bonds - 20%
Fixed deposit - 20%
Gold - 5%
Stocks - 10% ( Majority of this in dividend funds)
Other Asset Classes - 5%

My belief is that stocks are relatively overvalued compared to bonds and attractive buying opportunities can come along after 1-2 years. In a deflationary scenario no asset class does well other than U.S bonds, the U.S dollar and the Japanese yen, so better to be safe than sorry with high quality government bonds and fixed deposits. Cash is the king always. Of course this varies with the person's age.