About

Ahead of the Curve provides you with analysis and insight into today's global financial markets. The latest news and views from global stock, bond, commodity and FOREX markets are discussed. Rajveer Rawlin is a PhD and received his MBA in finance from the Cardiff Metropolitan University, Wales, UK. He is an avid market watcher having followed capital markets in the US and India since 1993. His research interests includes areas of Capital Markets, Banking, Investment Analysis and Portfolio Management and has over 20 years of experience in the above areas covering the US and Indian Markets. He has several publications in the above areas. The views expressed here are his own and should not be construed as advice to buy or sell securities.

Featured post

Time Series Analysis with GRETL

This video shows key time-series analyses techniques such as ARIMA, Granger Causality, Co-integration, and VECM performed via GRETL. Key dia...

Wednesday 29 April 2015

Has the Fed Ignited the Sell in May and Go Away Trade?

First and foremost most fed meetings are positive for the stock market. The fed usually gives the market what it wants and the markets keep going up and away. The last fed meeting stocks rallied after the fed successfully jaw boned the dollar into submission. Since then stocks have rallied and are encountering major resistance at the top end of their trading ranges.
S&P 500 (^GSPC)
The dollar has sold off close to 5% but has already contributed to  very weak quarterly earnings reports from several global powerhouses. With Greece lurking in the shadows any Euro strength may be short lived going forward and a resumption of broader dollar strength is likely.
EUR/USD (EURUSD=X)
This could spell trouble for commodities like gold and oil and other risk assets.
SPDR Gold Shares (GLD)
United States Oil ETF (USO)

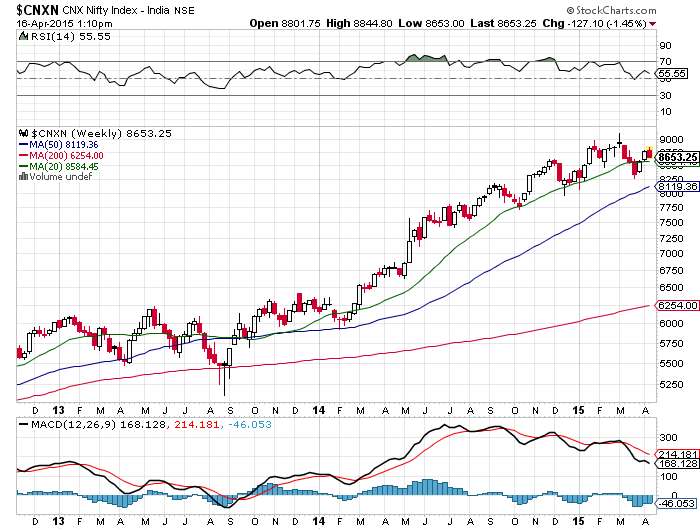
Eventually carry trade liquidation could spread to stock indices, with some recent bastions of strength like the German and Indian markets already showing some cracks.
DAX (^GDAXI)
CNX NIFTY (^NSEI)

Eventually markets will come around to the realization that QE forever polices globally have artificially propped up asset prices and their implosion is just around the corner in a painful and protracted process, with the "Sell in May and Go Away" trade just round the corner.

Strangle Strategy for a Volatile Nifty Post the Fed Announcement Tonight

Volatility in the market has been surging of late with the India Vix eclipsing the 20 level of late. I expect this to continue post the fed. A strangle can help capture market volatility on either side.

Nifty Current Spot: 8280
CNX NIFTY (^NSEI)
8300 April Call - 35
8200 April put -19
Break even = 54
Break even points -8354, 8146
You make money on either side of 8146, 8354
You loose money if market stays between the above two levels.

Tuesday 28 April 2015

Market Pulse Option Interest: Option Open Interest for 28-04-2015

Great Summary of F&O data, Market Pulse Option Interest: Option Open Interest for 28-04-2015: Inference The Index opened flat and stayed positive but saw a few dips towards 8200 which were bought with ease and a final short...

Trending Waves : Elliott Wave Stock Market Update - April 27

US market technicals from trending waves. Trending Waves : Elliott Wave Stock Market Update - April 27: The market made another all time high today as expected but the wave fell couple of points short of the ascending trian...

Monday 27 April 2015

Tracking and Cracking The Indian Stock Market: 10 Points For Traders-Must Read

Tracking and Cracking The Indian Stock Market: 10 Points For Traders-Must Read: Share This

Saturday 25 April 2015

Trending Waves : Elliott Wave Stock Market Update - April 24

Some fantastic daily US market technical analysis:

Trending Waves : Elliott Wave Stock Market Update - April 24: The market made a marginally higher high today and it looks like new highs will be coming early next week as well. Ther...

Thursday 23 April 2015

Is the Rupee sending a warning signal to the stock market?

The last time there was significant Rupee weakness was back in August 2013 when the Nifty crashed closed to 20% led by bank stocks that crashed over 30%. Fast forward to today and significant Rupee weakness has started to re-emerge with the Rupee recently breaching the 64 level.
USD/INR (INR=X)
This has yet again caused bank stocks to underperform with the bank nifty down close to 10% from recent highs and further under performance is likely if the Rupee sells off further.
BANK NIFTY (^NSEBANK)
This would also prevent rates from coming down in the short term which is not good for the overall economy and the stock market.
CNX NIFTY (^NSEI)
Recently Indian stock stock market volatility has significantly exceeded US stock market volatility with the India vix crossing 19, yet another warning sign.

The stage appears to be set for significant equity underperformance in 2015.

S and P 500 VIX Ratio Suggestive of a Topping Process

It is noteworthy that the Vix is no longer making new lows as the S and P 500 is making new highs. The S and P Vix ratio is making a long term rounding top, which is highly suggestive of a near term topping process in the S and P.There have been no new highs in this ratio in more than 11 months, suggesting that volatility is outperforming the market and may surge upwards in the upcoming months. Chart courtesy StockCharts.com.

Visit StockCharts.com to see more great charts.

Sunday 19 April 2015

Transports S and P 500 ratio, No new highs in more than 1 year

For a healthy advance in the market according to dow theory the transports ought to be making or conforming new highs in the broader market. Taking a look at the transports S and P 500 ratio, there has been significant underperformance of the transports of late, with no new highs in the transports and consequently the transports s and p 500 ratio since the December of last year. A major bearish divergence. Chart courtesy StockCharts.com.

Hottest Deals On Refurbished Apple Products | JemJem Visit StockCharts.com to see more great charts.

Thursday 16 April 2015

Why 8100 is a very important Number for the Nifty?

In more than a year now since this bull run began the Nifty has not violated its 20 day weekly moving average (WMA) which comes in at 8100. That all changed recently where we broke and closed below the 20 WMA for several days and are just below that level now. The breach of this level to the upside suggests some strength ahead. If this level acts as resistance there could be trouble ahead and a major change in trend could emerge with the 20 WMA acting as major resistance going forward. Chart courtesy StockCharts.com.

Hottest Deals On Refurbished Apple Products | JemJem Visit StockCharts.com to see more great charts.

Monday 13 April 2015

Update on Nifty Strangle, Time to Book Profits

I had highlighted the Nifty 8400-8800 strangle at 95 in an earlier post.
http://rajveersmarketviews.blogspot.in/2015/04/option-trading-strategy-indian-market.html
As of Now
Nifty - Current Spot - 8823
CNX NIFTY (^NSEI)
Nifty 8400 Put - 15
Nifty 8800 Call - 135
Total -150
Profit -55%
Time to book profits!

Tuesday 7 April 2015

Option strategy to capture the next big move in the market

It appears that volatility will be the name of the game going forward. The Vix appears to be headed upwards in the short term. If volatility was to surge upwards implied volatility on options would do the same. On the daily chart the S and P 500 looks set to break out of a coiled spring like formation out of its recent trading rage between 2040 and 2120.  A strangle strategy would help in capturing this as earnings season begins.
Current S and P 500 spot - 2076
S&P 500 (^GSPC)

Looking at options prices on the CBOE expiring April 30:
2070 puts are available near $25
2080 calls are available near $24
Break even points - 2021, 2129
make money - below 2021 or above 2129
loose money - between 2021 and 2129.

It is note worthy that several asset classes are on the verge of breakouts from their recent trading ranges and such a strategy could be extended to them. In the commodity space gold, copper and crude stand out:

United States Oil ETF (USO)
SPDR Gold Shares (GLD)
In the forex space the Japanese Yen crosses particularly EUR/JPY, AUD/JPY and GBP/JPY stand out:
EUR/JPY (EURJPY=X)
AUD/JPY (AUDJPY=X)

Sunday 5 April 2015

Option Trading Strategy Indian Market

I expect the market to be volatile leading up to and beyond the RBI meeting on Tuesday the 7 th. It is best to be two sided in this market. The 20 DMA has crossed below the 50 DMA on the Nifty so short term bias maybe to the downside. Regardless a two way strangle seems to offer good value.

Nifty - Current Spot - 8594
Nifty 8400 Put - 51
Nifty 8800 Call - 44
CNX NIFTY (^NSEI)

You can buy the above two options for a combined premium of 95. The break even occurs at 8305 and 8895. If market stays between the break even points you lose 95X 25 (per nifty lot) at expiry. I expect a big move in the market post the RBI decision that will cause a break out of this trading range.

As of Market close on April 10:
Nifty - Current Spot - 8780
Nifty 8400 Put - 19
Nifty 8800 Call - 104
Profit = 30%

Stock Market News

Amazon Deals

World Indices


Live World Indices are powered by Investing.com

Market Insight

My Favorite Books

  • The Intelligent Investor
  • Liars Poker
  • One up on Wall Street
  • Beating the Street
  • Remniscience of a stock operator

See Our Pins

Trading Ideas

Forex Insight

Economic Calendar

Economic Calendar >> Add to your site

India Market Insight

My Asset Allocation Strategy (Indian Market)

Cash - 40%
Bonds - 20%
Fixed deposit - 20%
Gold - 5%
Stocks - 10% ( Majority of this in dividend funds)
Other Asset Classes - 5%

My belief is that stocks are relatively overvalued compared to bonds and attractive buying opportunities can come along after 1-2 years. In a deflationary scenario no asset class does well other than U.S bonds, the U.S dollar and the Japanese yen, so better to be safe than sorry with high quality government bonds and fixed deposits. Cash is the king always. Of course this varies with the person's age.