About

Ahead of the Curve provides you with analysis and insight into today's global financial markets. The latest news and views from global stock, bond, commodity and FOREX markets are discussed. Rajveer Rawlin is a PhD and received his MBA in finance from the Cardiff Metropolitan University, Wales, UK. He is an avid market watcher having followed capital markets in the US and India since 1993. His research interests includes areas of Capital Markets, Banking, Investment Analysis and Portfolio Management and has over 20 years of experience in the above areas covering the US and Indian Markets. He has several publications in the above areas. The views expressed here are his own and should not be construed as advice to buy or sell securities.

Featured post

Time Series Analysis with GRETL

This video shows key time-series analyses techniques such as ARIMA, Granger Causality, Co-integration, and VECM performed via GRETL. Key dia...

Showing posts with label stock market exchange. Show all posts

Wednesday, 29 April 2015

Has the Fed Ignited the Sell in May and Go Away Trade?

First and foremost most fed meetings are positive for the stock market. The fed usually gives the market what it wants and the markets keep going up and away. The last fed meeting stocks rallied after the fed successfully jaw boned the dollar into submission. Since then stocks have rallied and are encountering major resistance at the top end of their trading ranges.
S&P 500 (^GSPC)
The dollar has sold off close to 5% but has already contributed to  very weak quarterly earnings reports from several global powerhouses. With Greece lurking in the shadows any Euro strength may be short lived going forward and a resumption of broader dollar strength is likely.
EUR/USD (EURUSD=X)
This could spell trouble for commodities like gold and oil and other risk assets.
SPDR Gold Shares (GLD)
United States Oil ETF (USO)

Eventually carry trade liquidation could spread to stock indices, with some recent bastions of strength like the German and Indian markets already showing some cracks.
DAX (^GDAXI)
CNX NIFTY (^NSEI)

Eventually markets will come around to the realization that QE forever polices globally have artificially propped up asset prices and their implosion is just around the corner in a painful and protracted process, with the "Sell in May and Go Away" trade just round the corner.

Thursday, 23 April 2015

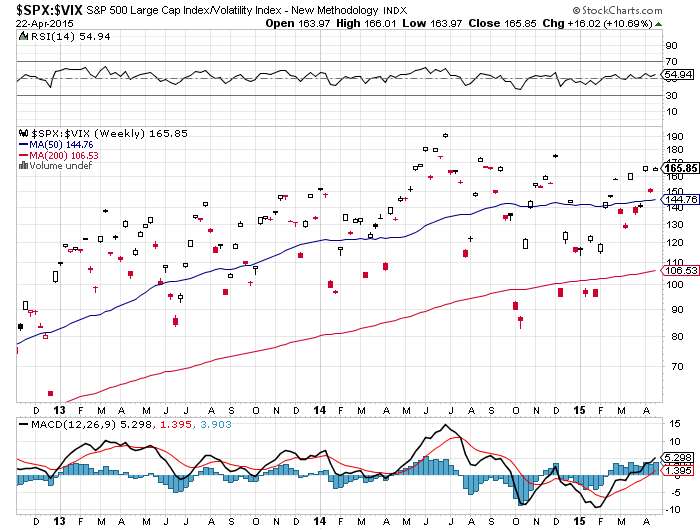
S and P 500 VIX Ratio Suggestive of a Topping Process

It is noteworthy that the Vix is no longer making new lows as the S and P 500 is making new highs. The S and P Vix ratio is making a long term rounding top, which is highly suggestive of a near term topping process in the S and P.There have been no new highs in this ratio in more than 11 months, suggesting that volatility is outperforming the market and may surge upwards in the upcoming months. Chart courtesy StockCharts.com.

Visit StockCharts.com to see more great charts.

Sunday, 19 April 2015

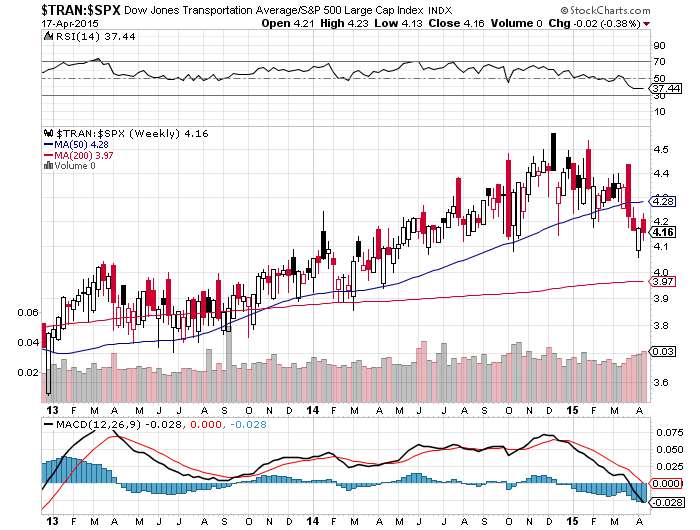
Transports S and P 500 ratio, No new highs in more than 1 year

For a healthy advance in the market according to dow theory the transports ought to be making or conforming new highs in the broader market. Taking a look at the transports S and P 500 ratio, there has been significant underperformance of the transports of late, with no new highs in the transports and consequently the transports s and p 500 ratio since the December of last year. A major bearish divergence. Chart courtesy StockCharts.com.

Hottest Deals On Refurbished Apple Products | JemJem Visit StockCharts.com to see more great charts.

Thursday, 16 April 2015

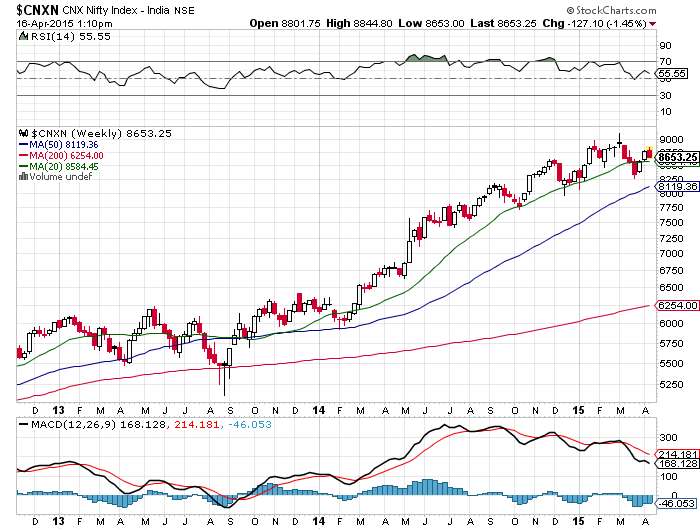
Why 8100 is a very important Number for the Nifty?

In more than a year now since this bull run began the Nifty has not violated its 20 day weekly moving average (WMA) which comes in at 8100. That all changed recently where we broke and closed below the 20 WMA for several days and are just below that level now. The breach of this level to the upside suggests some strength ahead. If this level acts as resistance there could be trouble ahead and a major change in trend could emerge with the 20 WMA acting as major resistance going forward. Chart courtesy StockCharts.com.

Hottest Deals On Refurbished Apple Products | JemJem Visit StockCharts.com to see more great charts.

Monday, 13 April 2015

Update on Nifty Strangle, Time to Book Profits

I had highlighted the Nifty 8400-8800 strangle at 95 in an earlier post.
http://rajveersmarketviews.blogspot.in/2015/04/option-trading-strategy-indian-market.html
As of Now
Nifty - Current Spot - 8823
CNX NIFTY (^NSEI)
Nifty 8400 Put - 15
Nifty 8800 Call - 135
Total -150
Profit -55%
Time to book profits!

Tuesday, 7 April 2015

Option strategy to capture the next big move in the market

It appears that volatility will be the name of the game going forward. The Vix appears to be headed upwards in the short term. If volatility was to surge upwards implied volatility on options would do the same. On the daily chart the S and P 500 looks set to break out of a coiled spring like formation out of its recent trading rage between 2040 and 2120.  A strangle strategy would help in capturing this as earnings season begins.
Current S and P 500 spot - 2076
S&P 500 (^GSPC)

Looking at options prices on the CBOE expiring April 30:
2070 puts are available near $25
2080 calls are available near $24
Break even points - 2021, 2129
make money - below 2021 or above 2129
loose money - between 2021 and 2129.

It is note worthy that several asset classes are on the verge of breakouts from their recent trading ranges and such a strategy could be extended to them. In the commodity space gold, copper and crude stand out:

United States Oil ETF (USO)
SPDR Gold Shares (GLD)
In the forex space the Japanese Yen crosses particularly EUR/JPY, AUD/JPY and GBP/JPY stand out:
EUR/JPY (EURJPY=X)
AUD/JPY (AUDJPY=X)

Sunday, 5 April 2015

Option Trading Strategy Indian Market

I expect the market to be volatile leading up to and beyond the RBI meeting on Tuesday the 7 th. It is best to be two sided in this market. The 20 DMA has crossed below the 50 DMA on the Nifty so short term bias maybe to the downside. Regardless a two way strangle seems to offer good value.

Nifty - Current Spot - 8594
Nifty 8400 Put - 51
Nifty 8800 Call - 44
CNX NIFTY (^NSEI)

You can buy the above two options for a combined premium of 95. The break even occurs at 8305 and 8895. If market stays between the break even points you lose 95X 25 (per nifty lot) at expiry. I expect a big move in the market post the RBI decision that will cause a break out of this trading range.

As of Market close on April 10:
Nifty - Current Spot - 8780
Nifty 8400 Put - 19
Nifty 8800 Call - 104
Profit = 30%

Thursday, 26 March 2015

Nifty Gold Uptrend in Question

Visit StockCharts.com to see more great charts.
The Nifty has been in a continuous uptrend against gold (in dollars). Gold has been falling on deflationary fears. As the deflationary theme plays out and eventually spreads to risky assets like stocks a catch up to the downside is likely for stock market indices like the Nifty. A pull back thus seems to appear on the charts with Nifty under performance vis a vis gold in a deflationary context.Chart courtesy StockCharts.com.


Monday, 23 March 2015

Nifty Over Extended Vs the Dollar

The Nifty has been even out performing even the strong dollar off late.  The dollar has been strengthening significantly this year and has virtually out performed a whole host of asset classes. The Nifty and few other stock indices like the S and P 500 and the German Dax have outperformed the dollar. A bit of under performance vs the dollar has begun and is overdue for the Nifty. Chart courtesy StockCharts.com.


Visit StockCharts.com to see more great charts.

Sunday, 22 March 2015

Baltic Dry Index still near life lows

Check out this chart from StockCharts.com for the baltic dry index, which is close to its life lows and down over 95% from the highs set in 2008. Obviously the massive influx of liquidity form QE's in the US, Europe and Japan hasn't really helped the global economy.


Visit StockCharts.com to see more great charts.

Monday, 16 March 2015

Behind the tantrums of QE withdrawal lies a very grave deflationary threat

Last week most risk assets sold of on the prospects of QE withdrawal following strong job numbers out of the U.S. Here's how things shaped up:
The S & P 500 was down well over 1%
Gold  was down close to 1%
Oil was down close to 10%
Copper was up about 2.5%
Emerging markets were down close to 3%
The clear winner was the dollar which surged nearly 2%

If markets were really bothered about inflation, gold and oil would be going through the roof instead they have absolutely collapsed over the past year:
SPDR Gold Shares (GLD)
United States Oil ETF (USO)

In addition the flight to quality trade that surfaced during the recession of 2008 into the dollar seems to have emerged with a vengeance:
PowerShares DB US Dollar Bullish ETF (UUP)
While one may want to brush aside the emergence of deflation which has already started to surface in recent PPI and CPI numbers, let's not forget what it did to Japan since the early 90's. Despite the all out war to contain deflation in Japan interest rates are still negative and the stock market which has rallied off late is still down over 50% from the highs it set in 1989.

Friday, 13 March 2015

My Asset Allocation Strategy (Indian Market)

Cash - 40%
Bonds - 20%
Fixed deposit - 20%
Gold - 5%
Stocks - 10% ( Majority of this in dividend funds)
Other Asset Classes - 5%


My belief is that stocks are relatively #overvalued compared to bonds and attractive buying opportunities can come along after 1-2 years. In a deflationary scenario no asset class does well other than U.S bonds, the U.S dollar and the Japanese #yen, so better to be safe than sorry with high quality government bonds and fixed deposits. Cash is the king always. Of course this varies with the person's age.

Wednesday, 4 March 2015

Very Bad Sign When Markets go Down on Rate Cuts

It is a very bad sign when markets go down on good news. While the rate cuts from the RBI could be construed as a good sign in the short term, it is also a tacit admission to rapidly slowing growth in the future. Given the stock market is a discounting mechanism slowing growth and earnings downgrades are not factored into current stock prices and more declines are likely in the future as equity markets factor in a global recessionary outlook caused by rampant deflation.

CNX NIFTY (^NSEI)

Ultimately these rate cuts do also signal Rupee weakness versus the dollar in the long term and that most certainly wont help our deficits and the ambitious targets for the fiscal deficits proposed in the recent budget and our GDP estimates will mostly likely come down to the 5-6 % mark for the upcoming year. All in all a very negative outlook for equity prices in the upcoming year.
USD/INR (INR=X)

Friday, 27 February 2015

Major Sell off likely post the budget

yes the budget is here but that's where the good news ends. Markets appear overvalued at trailing P/E's of well over 22.  Have a look at the data below:

2008 GDP - 7.5%, Dollar/Rupee - 42, Stock market Peak January - 6350, P/E -24, 3 month return from Jan 08  < -30%
2015 GDP - 5.5%, Dollar/Rupee - 62, Stock market Peak till date - 9119, P/E -24, It remains to be seen how much of a decline will occur, as of now -6.0%.

CNX NIFTY (^NSEI)

So clearly the stock market has advanced on weak fundamentals and rapidly deteriorating macros and no matter how great the budget, a substantial sell off beckons.

Wednesday, 18 February 2015

Warning Signs for Global Financial Markets in 2015-16

There are two major warning signs that are developing for risk assets in 2015:

Hottest Deals On Refurbished Apple Products | JemJem
First we have significant #dollar strength despite a recent bounce in the euro, with the dollar index hitting multi-year highs. This is on the back of the potential end to the quantitative easing by the fed but also due to weakening fundamentals in the# Euro Zone which is mired in a deep recession and is unlikely to come out of it any time soon despite huge dosages of QE from the ECB.
PowerShares DB US Dollar Bullish ETF (UUP)

stock quotes
Even after another bailout for Greece, which is tantamount to throwing good money after bad dollar strength is all set to continue and would result in a serious bout of carry trade liquidation that could take down commodities, emerging market currencies and eventually global stock markets:
Global Commodity Equity ETF (CRBQ)
Market Vectors EM Local Currency Bd ETF (EMLC)
S&P 500 (^GSPC)

PureVPN
The second major development is the potential upsurge in volatility. The #Vix index has not made new lows on each of the recent new highs for the S and P 500 in well over a year and is holding support in a multi year rounding bottom formation. This has resolved into higher prices for the Vix over the 50 level in August and lower prices for risk assets across the board. The Vix is incidentally well above it's 52 week low of 10.28.
VOLATILITY S&P 500 (^VIX)
Both these trends are set to continue into 2016 which could result in significant under performance of financial markets across the globe.

Tuesday, 3 February 2015

Down goes the Baltic Dry Index yet again

Another 28 year low for the baltic dry index, now down over 95% from it's all time highs, questioning the so called economic recovery these last 5 years and confirming that QE forever policies in the US, Japan and the Euro Zone are destined for failure. Eventually the weak economy globally should translate into lower asset prices across the globe.

Hottest Deals On Refurbished Apple Products | JemJem DMS Baltic Index I (DBIAX)

Tuesday, 6 January 2015

Earnings Yield Suggesting Nifty still overvalued

The #Nifty currently sports a #P/E ratio (trailing) in excess of 20 (Data courtesy Sanjay Jaiswal at Market Pulse):
Nifty p/e


Invert this and you get an earnings yield of 5.0%, you can add about 1.2% for dividends bringing the total to 6.2%, the current risk free rate which is the return on 1 yr bonds is about 7.5%, so why bother investing in risky stocks to generate 6.2% when you can earn 7.5% in the bank risk free?

CNX NIFTY (^NSEI)
So despite the recent correction the market is still overvalued and will most likely fall further in the near term.

Tuesday, 16 December 2014

The dominoes keep falling one after another

Lets take a look at a few charts courtesy yahoo finance and market watch.com. First we started with the well over 95% crash in the Baltic dry index (#bdi).
Hottest Deals On Refurbished Apple Products | JemJem DMS Baltic Index I (DBIAX)
Then we had a over 40% plunge in #gold and #silver prices as symbolized by the respective ETF's:


share prices

This was matched by over a 40% plunge in base metals:


Followed by the dramatic over 50% plunge in #oil:
Symantec Corp.

This has translated into a rout in the junk bond market:
SPDR Barclays High Yield Bond ETF (JNK)
Which will most certainly nail banks which have exposure to this toxic stuff:
KBW Bank Index (^BKX)

No surprise then at the flight to quality bid emerging in US treasuries and the #dollar:
Treasury Yield 30 Years (^TYX)
PowerShares DB US Dollar Bullish ETF (UUP)

PureVPN
And carry trade liquidation should start any moment with a bid for the Japanese #Yen:
USD/JPY (JPY=X)

All in all we have sown the seeds for the great depression of the 21 st century and the U.S Fed and its fellow central banks can do absolutely nothing about it.

World Indices


Live World Indices are powered by Investing.com

Market Insight

My Favorite Books

  • The Intelligent Investor
  • Liars Poker
  • One up on Wall Street
  • Beating the Street
  • Remniscience of a stock operator

See Our Pins

Trading Ideas

Forex Insight

Economic Calendar

Economic Calendar >> Add to your site

India Market Insight

My Asset Allocation Strategy (Indian Market)

Cash - 40%
Bonds - 20%
Fixed deposit - 20%
Gold - 5%
Stocks - 10% ( Majority of this in dividend funds)
Other Asset Classes - 5%

My belief is that stocks are relatively overvalued compared to bonds and attractive buying opportunities can come along after 1-2 years. In a deflationary scenario no asset class does well other than U.S bonds, the U.S dollar and the Japanese yen, so better to be safe than sorry with high quality government bonds and fixed deposits. Cash is the king always. Of course this varies with the person's age.