About

Ahead of the Curve provides you with analysis and insight into today's global financial markets. The latest news and views from global stock, bond, commodity and FOREX markets are discussed. Rajveer Rawlin is a PhD and received his MBA in finance from the Cardiff Metropolitan University, Wales, UK. He is an avid market watcher having followed capital markets in the US and India since 1993. His research interests includes areas of Capital Markets, Banking, Investment Analysis and Portfolio Management and has over 20 years of experience in the above areas covering the US and Indian Markets. He has several publications in the above areas. The views expressed here are his own and should not be construed as advice to buy or sell securities.

Featured post

Time Series Analysis with GRETL

This video shows key time-series analyses techniques such as ARIMA, Granger Causality, Co-integration, and VECM performed via GRETL. Key dia...

Showing posts with label bear market. Show all posts

Thursday, 8 September 2016

Chart of the Week - Libor Spikes Vs S & P 500

The chart of the week is courtesy Bob Hoye via SafeHaven and looks at spikes in the 3 month LIBOR rate vs S and P 500 performance. Any sustained spikes in LIBOR in excess of 25 basis points in the last year has often resulted in significant stock market pull backs as seen in August 2015 and February 2016. There is usually a lag of about 2 months for the sell off to occur. We had a recent LIBOR spike about 2 months ago and should see a stock market pull back soon. More importantly LIBOR has entered a clear uptrend this past year and that is problematic for risk assets long term:

Libor 2015-2016

Wednesday, 22 June 2016

Gold Rush Coming?

Is a gold rush coming much like in 2000 and have gold bears got it wrong this time around, Here is an interesting take from our partners at the The WallStreet Window:

Proof that the Gold Bears are Wrong – Mike Swanson

I am bullish on gold and I own gold and mining stocks, because gold is in a bull market. I have been trying to do my best to tell people this, but many people simply do not believe it. Gold and the mining stocks went through a very brutal bear market for five years and that makes it hard for people to believe that any of the rallies are real.

 What is more there are several “experts” that keep calling for gold to fall to $1,000 or even $250 an ounce that are scaring people out of gold. If you read this post you will see why these gold bears are wrong and know the one thing you need to know now that proves that gold is in a new bull market.
Then you will know that you do not have to be afraid and that you can take action. This is why people are looking at it.
gold 1

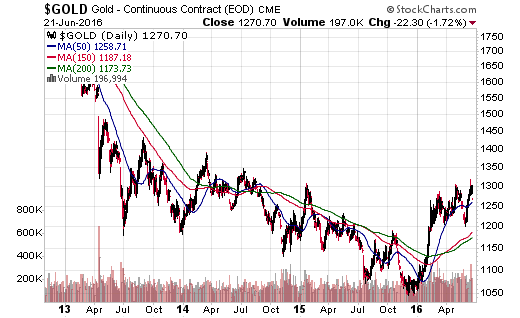
What people are seeing is a rally up to $1,300 in gold this year and a pullback of that level happening right now.That pullback is making gold bears call for a crash again and scaring people out of gold and I know because I am getting lots of emails from people scared or trying to jump out of mining stocks in hopes of buying in at a much lower price.

This rally in gold has brought an over 100% gain for most mining stocks and has made the mining stock sector the best performing sector in the entire stock market so far this year. Those in mining stocks this year are killing the stock market. And yet people are scared of a giant gold drop. Here is what I see:
gold 2


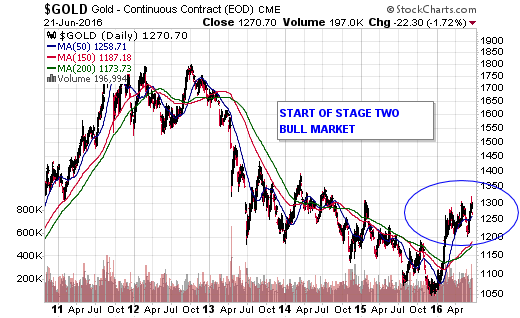
When you step back and look at the big picture of gold it is obvious that gold was in a bear market for a few years. You know that, but what is important is that during bear markets the 150 and 200-day moving averages slope down and act as resistance. But in January gold smashed through these moving averages and now those moving averages are turning up to act as support. I use classic stage analysis to identify whether a market is in a bull or bear market and it is obvious that gold is in a bull market now:
market stages

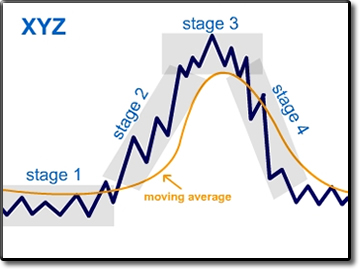
There are four stages to a financial market cycle in a stock or an entire financial market. As you know you can have a bull market. Before a bull market starts though you usually have a stage one basing phase in which a market simply goes sideways and builds a base. Then it breaks out and begins a full blown stage two bull market that typically lasts for several years. Then there is a stage three topping phase and then a stage four bear market.

There are various technical indicators you can use to determine when these stages are coming to an end so you can make the proper adjustments. That's a topic a little too big to get into now, but we can look at the basics right now. I can quickly show you one important indicator to watch to identify the trend the market is in. That's the long-term 150-day moving average, which is simply a line plotted on a chart using the average price number of the past 150-days.

In a bull market this line slopes up on a chart and the price of the market tends to stay above it, so it acts as a nice price support level in a bull market to make for a good entry point timing mechanism.
In a bear market this line slopes down on a chart and the price of the market tends to stay below it and it acts as resistance. So you can use this moving average to quickly identify the trend of a market. Then you can know if you should be bullish on a market or not.

Of course I have been pointing this out for the past several months and it has not stopped the gold bears from predicting more gold crashes and has not stopped people from trying to jump in and out of gold every time there is a little weakness so let me show you one more thing that is even more important. There is a huge powerful trend that happens in gold bull markets and that is that the mining stocks tend to lead the price of gold higher.

In bear markets the opposite happens. When there is a gold bear market the mining stocks tend to fall much more than the price of gold does. At big tops in gold and silver the mining stocks often stop going up. So when silver prices made a final top in 2011 the mining stocks simply sat there as silver went higher.

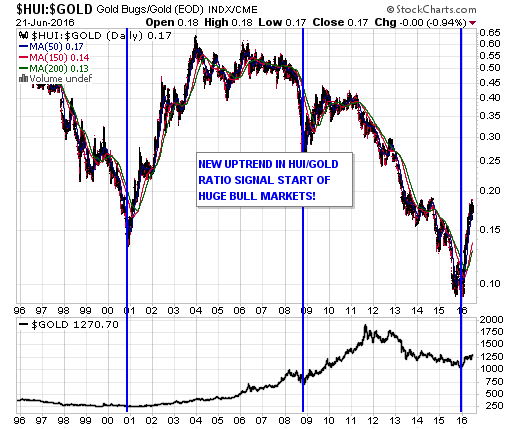
And now this year the mining stocks are leading gold up. When gold has a temporary pullback they just come off their highs a little bit and then go up more. Now you can chart out whether the mining stocks are doing better than gold or worse by using the simple HUI divided by the price of gold ratio.
Take a look at it:
hui gold ratio

As you can see the mining stocks lagged gold for years and a few months ago just started a new huge powerful trend of leading gold higher and outperforming gold.This is a huge predictor of gains to come for both mining stocks and gold and proves that the gold bears are simply wrong and mistaken.

For more on this visit our partner Michael Swanson on his website www.wallstreetwindow.com.

Wednesday, 6 April 2016

Chart of the Day - CSFB Fear Gauge

The chart of the day comes courtesy of ETFdaily news. It shows that while the market has been rallying off late and the Vix has been hitting lows near the 13 level, the CSFB fear gauge has surged to a record high. This shows that institutional investors have been buying out of the money put hedges in large amounts and are not believers in this rally:

csfb fear gauge

Chart of the Day - Bear Market Probability

The chart of the day is courtesy of Econmatters that shows bear market probabilities for the US stock market S & P 500 Index. The chart shows that despite the recent rally, the probability of a bear market is still pretty high:
bear market probability

Thursday, 10 December 2015

Interesting Market News and Views from Global Financial Markets-10

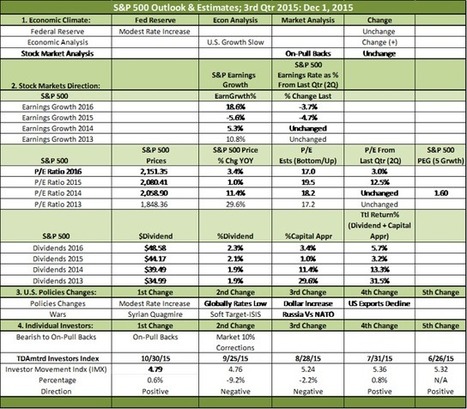
1) The S&P 500's Projected Index In 2016; Both P/E, Earnings And Economics

The 2016 Index for the S&P 500 will be 1,958.83, a loss of -5.8%.2015 P/E was 19.5X in our current survey (12/1/15) and last survey it was 17.3X, an increase of 12.7%.S&P 500 has gone from 91 (19%) co"


2) 4 Harbingers Of Stock Market Doom That Foreshadowed The 2008 Crash Are Flashing Red Again

So many of the exact same patterns that we witnessed just before the stock market crash of 2008 are playing out once again right before our eyes.  Most of the time, a stock market crash doesn't just come out of nowhere."  


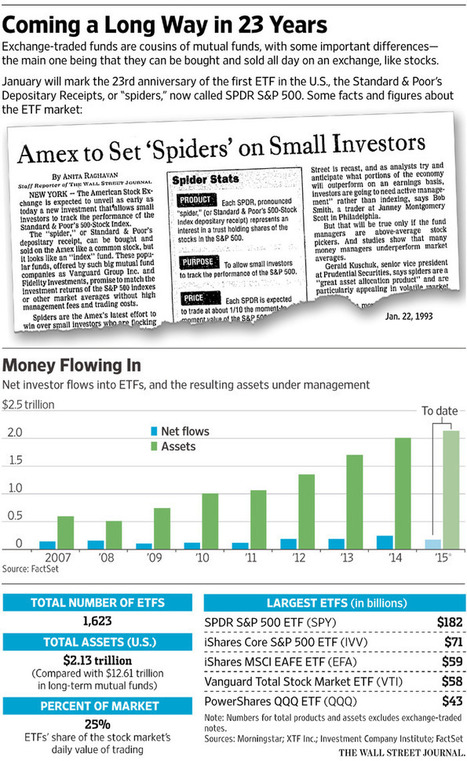
3) Should You Fear the ETF?

ETFs, after a spectacular run of popularity, are suddenly scaring regulators and some investors. We spell out the dangers—real and perceived."

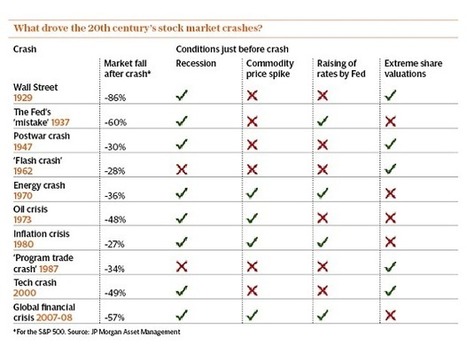
4) 'It's not 1929 again': statistical evidence we are NOT heading for a bear market

Is another bear market on its way? History’s lesson suggests there are four key ingredients and none are currently flashing red"

5) Globalization doesn't mean all stock markets are the same

Comment: It's not just about where you invest – but about the character of other investors in that market, writes Richard Evans"

6) The Stock Market Is Missing the Warning From Junk

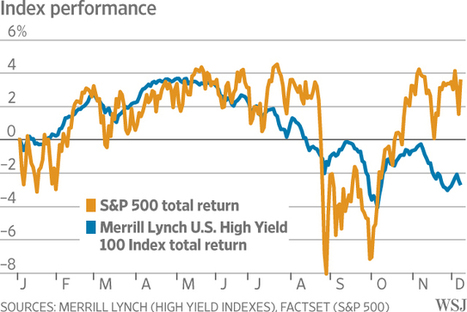
Junk bonds are headed for their first annual loss since the credit crisis, reflecting concerns that a six-year U.S. economic expansion and stock-market boom are on borrowed time."


Wednesday, 28 October 2015

Interesting Market News and Views from Global Financial Markets-4

1) S&P 500 back in black for 2015, Nasdaq leaps 2.3% - USA TODAY

Tech stocks power the rally on strong earnings from Microsoft, Amazon.com, Alphabet."

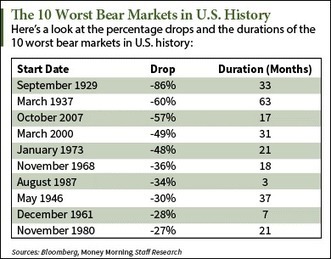
2) Bear Market History: The 10 Biggest S&P 500 Pullbacks - Money Morning

There are multiple signs pointing to a bear market in 2015. That's why we've compiled a list of the 10 worst drops in bear market history."


3) What's Really Driving the Stock Market's Big Rebound Rally? - The Fiscal Times

A combination of solid earnings (especially in tech) — as well as a fresh interest rat"

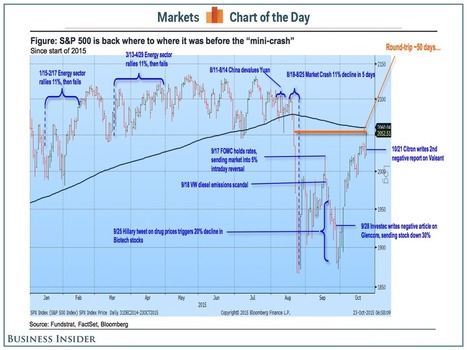
4) The S&P 500 is up an impressive 0% this year - Business Insider

Stocks, emerging market FX, and oil are well off their lows."

5) Techs lead Wall St. higher; S&P 500 erases 2015 loss - Reuters

A tech share rally drove U.S. stocks up sharply for a second day on Friday as earnings from companies including Microsoft beat analysts' expectations, while healthcare shares rebounded from recent losses."

6) What If The US Is Japan And Deflation Is Fate? - Seeking Alpha

Make no mistake about it – while we can talk about daily market movement and the news du jour, the reality is we live in a very small sample. The biggest macro"


World Indices


Live World Indices are powered by Investing.com

Market Insight

My Favorite Books

  • The Intelligent Investor
  • Liars Poker
  • One up on Wall Street
  • Beating the Street
  • Remniscience of a stock operator

See Our Pins

Trading Ideas

Forex Insight

Economic Calendar

Economic Calendar >> Add to your site

India Market Insight

My Asset Allocation Strategy (Indian Market)

Cash - 40%
Bonds - 20%
Fixed deposit - 20%
Gold - 5%
Stocks - 10% ( Majority of this in dividend funds)
Other Asset Classes - 5%

My belief is that stocks are relatively overvalued compared to bonds and attractive buying opportunities can come along after 1-2 years. In a deflationary scenario no asset class does well other than U.S bonds, the U.S dollar and the Japanese yen, so better to be safe than sorry with high quality government bonds and fixed deposits. Cash is the king always. Of course this varies with the person's age.