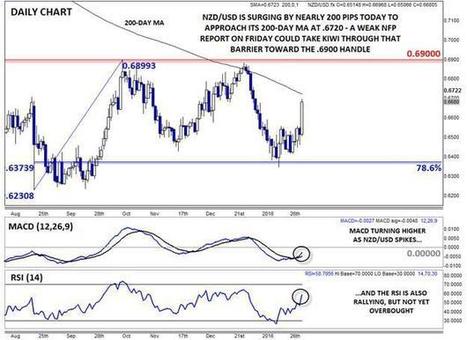
Here are some insights from the currency strategists at dailyfx. They cover the fundamentals and technicals of key Forex pairs and other key markets along with some of the key economic news of the day. Today's commentary looks at the S & P 500 post the payroll data out of the U.S:

Ahead of the Curve provides you with analysis and insight into today's global financial markets. The latest news and views from global stock, bond, commodity and FOREX markets are discussed.
Featured post
Time Series Analysis with GRETL
This video shows key time-series analyses techniques such as ARIMA, Granger Causality, Co-integration, and VECM performed via GRETL. Key dia...

Showing posts with label sp500. Show all posts
Showing posts with label sp500. Show all posts
Monday 10 October 2016
Friday 7 October 2016
Daily Forex Insight
Here are some insights from the currency strategists at dailyfx.
They cover the fundamentals and technicals of key Forex pairs and other
key markets along with some of the key economic news of the day.
Today's commentary looks at the dramatic collapse in the Pound and the S & P 500 ahead of payroll data out of the U.S:
Sunday 2 October 2016
Daily Forex Insight
Here are some insights from the currency strategists at dailyfx.
They cover the fundamentals and technicals of key Forex pairs and other
key markets along with some of the key economic news of the day.
Today's commentary looks at the Dollar, the S & P 500 and Gold:
Monday 26 September 2016
Chart of the Week - Technicals of Key Indices
The chart of the week is courtesy Marty Chenard at stocktiming.com and takes a technical look at some key indices. While most indices are above key resistance levels going back to 2014 the broadest of them all the Nyse composite index (NYA) is still below key resistance levels. Will the NYA join the other indices or the other indices begin to roll over will be worth watching in the upcoming months.

Daily Forex Insight
Here are some insights from the currency strategists at dailyfx.
They cover the fundamentals and technicals of key Forex pairs and other
key markets along with some of the key economic news of the day.
Today's commentary looks at possible range break outs in the Yen, Pound and the S & P 500:
Thursday 15 September 2016
Chart of the Week - Vix Futures CFTC Data
The chart of the week is courtesy the volatility surfer via seeking alpha and shows CFTC data on the Vix futures. Shorts on the Vix are at 10 year highs suggesting a high level of complacency in the market. This after the Vix has not made a new low on each of the recent new highs in the S and P 500 the last 2 years. Is volatility about to surge yet again in a seasonally week period for risk assets?


Wednesday 14 September 2016
Daily Forex Insight
Here are some insights from the currency strategists at dailyfx.
They cover the fundamentals and technicals of key Forex pairs and other
key markets along with some of the key economic news of the day.
Today's commentary looks at the dollar, the S & P 500 and the Pound:
Tuesday 13 September 2016
Daily Forex Insight
Here are some insights from the currency strategists at dailyfx.
They cover the fundamentals and technicals of key Forex pairs and other
key markets along with some of the key economic news of the day.
Today's commentary looks at the dollar and the S & P 500:
Thursday 8 September 2016
Chart of the Week - Libor Spikes Vs S & P 500
The chart of the week is courtesy Bob Hoye via SafeHaven and looks at spikes in the 3 month LIBOR rate vs S and P 500 performance. Any sustained spikes in LIBOR in excess of 25 basis points in the last year has often resulted in significant stock market pull backs as seen in August 2015 and February 2016. There is usually a lag of about 2 months for the sell off to occur. We had a recent LIBOR spike about 2 months ago and should see a stock market pull back soon. More importantly LIBOR has entered a clear uptrend this past year and that is problematic for risk assets long term:

Thursday 25 August 2016
S & P 500 Daily Outlook
Here is a daily view on the US stock market S and P 500 index from the analysts at Financial Doors. It covers the fundamentals and technicals of the S and P 500 index along with some of the key economic news of
the day.
Tuesday 23 August 2016
Chart of the Week - S & P 500 real sales growth
The chart of the week is via multpl.com and tracks real sales growth of the S & P 500 companies. Real sales growth as measured by the annual change in sales adjusted for inflation entered negative territory in 2015 and continues to remain so. The last time this occurred was in 2009. Will there be a similar price adjustment to reflect the declining fundamentals?


Sunday 21 August 2016
Daily Forex Insight
Here are some insights from the currency strategists at dailyfx.
They cover the fundamentals and technicals of key Forex pairs
and other key markets along with some of the key economic news of
the day. Today's commentary looks at the S & P 500 and the Yen:
Wednesday 17 August 2016
Chart of the Week - Cresmont P/E
The Chart of the week is courtesy Gary Gordon via seeking alpha and shows the Cresmont P/E ratio of the S & P 500. The ratio is currently at well over 2 standard deviations over the mean much like in 1930, 2000, and 2008 when the market experienced substantial sell offs. Will it be any different this time around?

Wednesday 10 August 2016
Chart of the Week - S & P 500 Seasonal Performance
The chart of the week is from Lance Roberts via seeking alpha and shows seasonal variations in S & P 500 performance since 1928. The period between August and October is the weakest period often generating
negative returns:

negative returns:
Wednesday 27 July 2016
Some Developing Non Conformations in the Stock Market
With yet another Fed day arriving there are a number of non conformations in the market which have not matched recent highs in the stock market. Charts are courtesy nasdaq.com:

1) No new highs in the Transports in over 1.5 years:

2) The same holds for the Russel 2000 small cap Index:

3) Financial stocks are lagging way behind:

4) Oil stocks are nowhere near their yearly highs:

5) Base metals like copper and related stocks are lagging way behind as well:

6) Last but not the least the CBOE Volatility Index the Vix (Chart from marketwatch.com) is yet to take out its yearly lows:

1) No new highs in the Transports in over 1.5 years:
2) The same holds for the Russel 2000 small cap Index:
3) Financial stocks are lagging way behind:
4) Oil stocks are nowhere near their yearly highs:
5) Base metals like copper and related stocks are lagging way behind as well:
6) Last but not the least the CBOE Volatility Index the Vix (Chart from marketwatch.com) is yet to take out its yearly lows:
Tuesday 7 June 2016
Chart of the Day - Growth in the S & P 500, P/E Ratio, Earnings
The chart of the day is courtesy the SRSrocco report and is a comparison of the increase in the S and P 500 and its P/E ratio since 2011 relative to its change in earnings. A pretty big divergence is seen with earnings growth lagging far behind. Either the earnings growth has to catch up or prices have to come down in line with the sub par earnings growth observed.

Wednesday 6 April 2016
Chart of the Day - Bear Market Probability
The chart of the day is courtesy of Econmatters that shows bear market probabilities for the US stock market S & P 500 Index. The chart shows that despite the recent rally, the probability of a bear market is still pretty high:

Tuesday 15 March 2016
Dollar Strength to Return?
Yet another FED day has come and gone, the dollar has been trending down and is approaching oversold levels and could trigger a risk off trade near term, here's how to play this:
1) Dollar Strength:
The dollar is oversold and is likely to bounce from oversold levels and strengthen against the Euro:
Can play this via the Ultralong Dollar ETF UUP:
2) This should trigger a selloff in commodities like gold, oil and base metals which are overbought:
Can play this via the ultra short basic materials ETF SMN:
3) The Volatility picture remains complacent suggesting a surge in volatility post the fed.
Can play it via the ultra long ETF on volatility UVXY:
4) This could trigger a selloff in stocks, with the S & P 500 breaking down out of a massive rising wedge on the long term charts courtesy stocktwits.com:

Can play this via ultra short ETF’s
5) Collapsing High Yield:
A high yield collapse is just around the corner and can be played via the ultra short ETF SJB:
Tuesday 16 February 2016
All is not Well with Global Financial Markets
It does appear that all is not as rosy as it used to be in the global financial market landscape:
First and foremost global shipping activity appears to have come to a screeching halt, as pointed out by Jeff Berwick via the Market Oracle and this likely has recessionary implications:

Secondly when a single bank's derivative exposure exceeds the GDP of a country or region you know you are bound to have problems as ETF daily news rightly points out the case of Deutsche Bank:

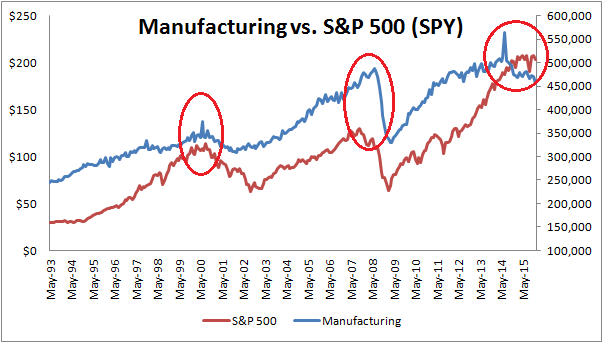
Thirdly as QuandaryFX points out via Seeking Alpha the S & P 500 starts turning down when manufacturing starts to turn down like we are seeing off late:
Last but not the least the Safehaven plunge into Gold,Treasuries & the Japanese yen is clearly taking hold as pointed out by Chris Vermeulen via CNA Finance:

Thursday 4 February 2016
Interesting Market News and Views from Global Financial Markets-15
It’s been a disastrous day for the world’s reserve currency: the US Dollar Index is trading down by over 1.5% to a new 3-month low near 97.00 and the greenback is falling against every one of her major rivals.

Ramesh Damani, member of the Bombay Stock Exchange (BSE), expects the upcoming union budget to decide the fate of stock markets in the medium term.
There is alot of action going on this week in all the different areas of the markets. The PM complex has been rallying, the US dollar tanking today and the stock markets trying to make up their mind which way they want to go ...
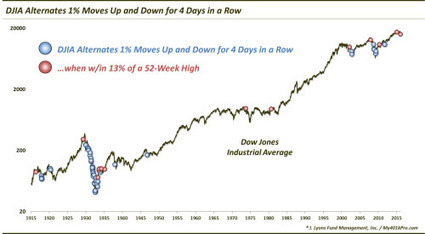
The Dow Jones Industrial Average just alternated 1% moves up and down for 4 days in a row – just the 17th such stretch in the last 70 years. The stock ...
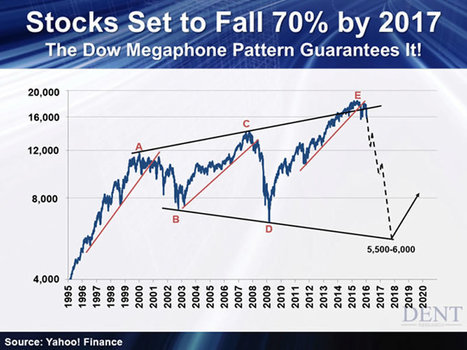
The Next Generational Bust Is Coming, Stock Market 70% Collapse :: The Market Oracle :: Financial Markets Analysis & Forecasting Free Website

On 01 Feb'16, market made a high of 7600.45 & on the consecutive days, we have been seeing continuous weakness.
Subscribe to:
Posts (Atom)
Market Insight
-
-
Biden Vs. Trump Matchup In This Traditionally Red State Shows Republican Party's Lead Could Shrink Due To This Factor - Louisiana, a traditional GOP stronghold, could reaffirm its allegiance to the party, according to new poll results. read more1 hour ago
-
Dozens Walk Out Of Jerry Seinfeld’s Duke Commencement Speech In Latest Graduation Protest - About 40 students participated in a walkout and protest while the comedian was awarded an honorary degree.2 hours ago
-
New Weekly on Deck - Weekly report covering Gold, Equities, Crude, Dollar. A look at trade opportunities and covering the model portfolio. The post New Weekly on Deck appeare...4 hours ago
-
Sunday links: selling a product - Markets - No news is good news for the stock market. (tker.co) - The stock market has gone nowhere the past 10 weeks. (allstarcharts.com) - ...4 hours ago
-
DoubleVerify Holdings, Inc. (NYSE:DV) Holdings Lowered by Los Angeles Capital Management LLC - Los Angeles Capital Management LLC lowered its stake in DoubleVerify Holdings, Inc. (NYSE:DV – Free Report) by 80.1% during the fourth quarter, according t...4 hours ago
-
10 Sunday Reads - Avert your eyes! My Sunday morning look at incompetency, corruption and policy failures: • The Modern Curse of Overoptimization: My current working defin...8 hours ago
-
Debt Rattle May 12 2024 - Pablo Picasso Le repos 1932 This painting has a story. It’s very funny. • 2024 Election Likely The Last To Be Decided By US Citizens – Musk (RT) • Jame...9 hours ago
-
Eliminating Cash in Australia ASAP – Number ONE Anti-Free Speech in the World - Macquarie Bank has announced it will Abolish Cash and it warns customers to prepare for the new CASHLESS WORD to ensure the government knows everything abo...15 hours ago
-
Russia Needs to Change Its Nuclear Doctrine | Sergey A. Karaganov - So there is the option of our nuclear strike on Ukraine.Sergey A. Karaganov: Such an option theoretically exists. But I am completely against it. People th...
 1 day ago
 -
Three Stocks: Micron Technology, AEye and Fat Brands - Three Stocks: Micron Technology, AEye and Fat Brands Micron Technology (MU) Micron Technology stock rallied for more than 4% on Friday after hit its best p...1 day ago
-
S&P 500 PE Ratio - *Current S&P 500 PE Ratio:* 27.14 +0.04 (0.16%) 4:00 PM EDT, Fri May 101 day ago
-
Red Alert! 6 Absolutely Gigantic Geomagnetic Storms Are About To Hit Earth, And Authorities Won’t Know Their True Power Until Friday Night - A series of enormous geomagnetic storms is about to start pummeling our planet, and some of the most important technologies that we depend on are potenti...1 day ago
-
Chart of the Day: Job Openings, Unemployment Rate & Stagflation - Have you missed any of Mike Carr's charts in Money & Markets Daily? See his recent coverage on job openings, unemployment, and stagflation. The post Char...
 2 days ago
 -
Lost in the Vast Wasteland of Social Media - *Once we've made "digital visibility" the primary source of our identity, status and self-respect, we've doomed ourselves to wandering, compass-less, in a ...3 days ago
-
-
Fluctuations in insurance premiums : Cycles in underwriting - The FRED Blog often uses data from the US Bureau of Labor Statistics (BLS): A few years ago, we used their Consumer Expenditures Survey to discuss the pref...3 days ago
-
Daily Market Brief - Subscriber content. To subscribe to the Daily Market Brief please visit Market Services on NorthmanTrader.com. The Daily Market Brief is an in-depth market...3 days ago
-
Neurocrine Biosciences (NBIX) Nears Buy Point Amid Rising Enthusiasm - Neurocrine Biosciences, Inc. (NBIX), a leading neuroscience-focused biopharmaceutical company, approaches the buy point amid growing market enthusiasm. The...3 days ago
-
WallStreetWindow Is Retiring As A News Website As Big Tech Turns More Authoritarian With “AI” - In Michael Mann’s 1981 movie Thief, the James Caan character comes to the decision to burn his bar and car dealership businesses down, because he cannot de...4 days ago
-
Cattle Prices Have Outrun Grain Prices - [image: wheat and cattle prices monthly] Most of the time, corn prices move in step with the futures prices for live cattle. This makes some sense from ...1 week ago
-
Navigating Market Bottoms: A 5-Step Checklist for Mastering Stock Entries - As volatility ripples through the markets, every investor is asking the same question: is it time to buy, or is caution still warranted? In this insightf...1 week ago
-
The Bank has published its annual report for the year 2023 - 2023 has been a fifth succeeding good year for Dukascopy Bank SA. The Bank’s net profit of 2023 was CHF 1.3 million. All subsidiaries of Dukascopy ...1 week ago
-
Weekend Update - Trendline rejection (3/8/24) - SPX was rejected by the blue trendline Friday. The trendline had been sucessfully tested four times and held since November, until now. SPX has unable ...
 2 months ago
 -
Catastrophic Risk: Investing and Business Implications - In the context of valuing companies, and sharing those valuations, I do get suggestions from readers on companies that I should value next. While I d...
 2 months ago
 -
Hello world! - Welcome to WordPress. This is your first post. Edit or delete it, then start writing!3 months ago
-
Teaching Johns Hopkins A Privilege Lesson - by Not Sure01/12/24Johns Hopkins Hospital Chief Diversity Officer Sherita Hill Golden sent a letter out essentially implying that all people who don’t look...3 months ago
-
Mungerisms: Timeless Wisdom from Charlie Munger on Life and Business - "Mungerisms" are succinct expressions of wisdom and insights coined by Charlie Munger, the Vice Chairman of Berkshire Hathaway and Warren Buffett's longtim...5 months ago
-
If You Find Deer or Elk Antlers on the Ground, Leave Them There, Say Some States - Even though elk do shed their antlers naturally, collecting them brings up a number of ethical issues.6 months ago
-
It’s Crunch Time for The Daily Doom and Doom Time for The Great Recession Blog - The Great Recession Blog is officially done for good, and it remains to be seen if all my writing continues on TheDailyDoom.com. If my writing on economi...10 months ago
-
Innovative Industrial Properties Stock a Great Way to Play Pot Sector - *IIPR Stock Represents a Long-Term Opportunity* Marijuana stocks briefly attracted investors' attention following the 2022 mid-term elections, when Maryl...1 year ago
-
2008 analogue - The 2008 analogue tape looks very interesting from where we stand. Let's anchor it to the next two Fed meetings -- since that's all that matters -- and i...
 1 year ago
 -
Back to trade with Bar Replay - It is often said that one should not be sad about the past, but sometimes it can be nice to return to it. Who would like to buy Tesla for $1 and experience...1 year ago
-
After This Holiday Rally, You Better Know When To Walk Away - This week’s investor insight will make you think twice about the current stock and bond rally as we head into the end of the year. We get a lot of questi...1 year ago
-
How Africa Can Escape Chronic Food Insecurity Amid Climate Change - The toll of extreme weather events on crops underscores the region’s challenges and need for policies to save lives and protect livelihoods.1 year ago
-
12 Bear Market Rules To Live By – Survive & Thrive In The Next Bear Market - 12 Bear Market Rules To Live By – Survive & Thrive In The Next Bear Market [image: Bear Market Rules Survival Guide] I grew up in the 1970s-1980s when th...1 year ago
-
Growth Companies – Getting What You Want - What do the growth companies in your field have in common? How are they doing so well and what can you learn from them? Growth companies usually make a pro...1 year ago
-
-
Blog Post Title - What goes into a blog post? Helpful, industry-specific content that: 1) gives readers a useful takeaway, and 2) shows you’re an industry expert. Use your c...2 years ago
-
Foot Locker Crushed Q2 Earnings Expectations Sending Stock Higher - Plus, AstraZeneca said its antibody therapy reduced the risk of developing COVID-19 symptoms by 77%, The Topps Co’s SPAC merger is off, and Elon Musk annou...2 years ago
-
Elliott Wave Stock Market Update - July 10th - The market has continued its rally to higher highs and it doesn't seem like it wants to stop. We now have a new ATH at 4371 which are NASDAQ levels s...
 2 years ago
 -
The Psychology of QE is Far More Important Than the Amount of It - Let's discuss what QE really does vs the psychology of QE.3 years ago
-
Hello world! - Welcome to WordPress. This is your first post. Edit or delete it, then start writing!3 years ago
-
Trading: Opportunities Are Dispersed - Opportunities are dispersed. You might have an... *READ THE REST OF THE ARTICLE ON THE NEW WEBSITE: JIM ROGERS TALKS MARKETS * *Jim Rogers is a legendary i...
 3 years ago
 -
Market Signals for the US stock market S and P 500 Index and Indian Stock Market Nifty Index for the Week beginning November 09 - Indicator Weekly Level / Change Implication for S & P 500 Implication for Nifty* S & P 500 3509, 7.32% Bullish Bullish Nifty 12264, 5.34% Neutral ** Bullis...3 years ago
-
November report "Is it True, as David Hume (1711 – 1776) postulated that, "Nothing is esteemed a more certain sign of the flourishing conditions of any nation than the lowness of interest"?" published. https://bit.ly/2y4LJZQ - November report "Is it True, as David Hume (1711 – 1776) postulated that, "Nothing is esteemed a more certain sign of the flourishing conditions of any n...3 years ago
-
Fully Automated Trend Trading w/ Stocks Or Options - There’s a lot of research to support the usage of trend indicators as simple risk reduction elements that can be layered onto an existing strategy. Howev...3 years ago
-
2020 Top Investment Picks – Q3 Update - At the beginning of the year, I put together a list of Top Investment Picks for 2020 from the investment community and track them on this website. This is ...3 years ago
-
Upside-Down Markets: Profits, Inflation and Equity Valuation in Fiscal Policy Regimes - I just published a new long-form piece through OSAM entitled “Upside-Down Markets: Profits, Inflation and Equity Valuation in Fiscal Policy Regimes.” In th...3 years ago
-
The last of 12326 - February 22nd 2012..... First post... https://permabeardoomster.blogspot.com/2012/02/can-anyone-fly-plane.html -- This post will be the last under the o...
 3 years ago
 -
-
Ultramarathoner Runs Over 200 Miles in Backyard, Wins Golden Toilet Paper Roll - Strange times indeed. In the land “BC,” before coronavirus, people ran long distances in foot races, and toilet paper wasn’t coveted. Things have changed. ...4 years ago
-
One Year Later - A year ago today I lost my father and my best friend, everyone here lost their mentor and a friend. Dad and I spent the last 7 years of his life living tog...4 years ago
-
-
Advanced Micro Devices (AMD) Retreating Towards Key Support Around $25.60-$27 -
AMD has failed to clear the 2018 high around $34.20. It is retreating, and has broken an August/September sup...
4 years ago -
Advanced Search is Now on Stocktwits - Advanced Search Is Now on Stocktwits Come rain or shine, the Stocktwits community shares over 200,000 messages per day. That includes charts, news, trade i...4 years ago
-
Nightly Algo Report – December 6, 2018 - To access this post, you must purchase Premium Plan or Premium Plan - Annual. The post Nightly Algo Report – December 6, 2018 appeared first on Elliottwa...5 years ago
-
Don’t be Fooled by the Pullback in the Dollar Because…. - Don’t be fooled by the pullback in the U.S. dollar today because the greenback could still strengthen further before the end of the year. Nearly all of the...5 years ago
-
A look at the bull market ahead - My latest missive on the near-term stock market outlook can be seen at Financial Sense web site. You can see it by clicking on the following link: https:/...6 years ago
-
Weekly Videos - This week’s video will be posted on the new home for Short Takes. If all goes well, it will appear sometime between 6:00 and 8:00 pm ET.6 years ago
-
Gold Miners near a buy zone - Gold cleared a several month long consolidation a few weeks ago as it cleared $1300, and has since been consolidating as it drifts back to […] The post G...6 years ago
-
Current Account Deficits and Safe Assets - The International Monetary Fund has issued its External Sector Report for 2017, and among its key findings: “Global current account imbalances were broadly...6 years ago
-
Kafka For The Twenty First Century - I've been spending a slightly frustrating day trying to update my payment details at google. To log in to my admin console I need to log in using my G Sui...
 7 years ago
 -
Gold Unleashed by Fed - Gold's next major upleg was likely unleashed by a very-dovish FOMC this week, which now has its hands tied on hiking rates or being hawkish due to the US e...7 years ago
-
August 24th Blogger Sentiment Poll - There are more bulls than bears in this week's poll. Blogger Sentiment Poll Participants: 24/7 Wall St (N) Carl Futia (+) Dash of Insight (+) Elliot Wave L...14 years ago


Forex Insight
-
Premium Forex Watch Recaps: May 6 – 10, 2024 - Market volatility cooled but there were a few key events that had the potential to setup short-term opportunities, including two central bank policy even...1 hour ago
-
Markets Week Ahead: Gold, US Dollar, Euro and Sterling Ahead of US CPI - US CPI data is likely to set the tone for the week alongside prominent Fed speeches. This article provides a one-stop-shop for all you need to know for the...2 hours ago
-
Could Worldcoin price shoot up 45% ahead of OpenAI’s live stream on Monday? - Read more on https://www.fxstreet.com5 hours ago
-
NZ dollar dips as Manufacturing PMI contracts - The New Zealand dollar is lower on Friday. NZD/USD is down 0.31% on the day, trading at 0.6015 in the European session at the time of writing. New Zealand ...2 days ago
-
Don’t be Fooled by the Pullback in the Dollar Because…. - Don’t be fooled by the pullback in the U.S. dollar today because the greenback could still strengthen further before the end of the year. Nearly all of the...5 years ago
-
EUR/USD Weekly Outlook - EUR/USD's decline attempt was contained at 1.0494, above 1.0493 support and rebounded. Initial bias stays neutral this week first. On the upside, break of ...7 years ago
-
Loonie and Aussie Share Downward Bond - In yesterday’s post (Tide is Turning for the Aussie), I explained how a prevailing sense of uncertainty in the markets has manifested itself in the form of...12 years ago
India Market Insight
-
Deciphering Market Dynamics: Unveiling the TIME CYCLE Scanner for F&O Stocks in May 2024 - Most of traders develop trading systems based on patterns we see in price action or in momentum or other indicators. But, what if we took “time” into acc...1 day ago
-
Tata Elxsi Q4 net profit, revenue decline QoQ; firm declares dividend of Rs 70 per share - [image: Tata Elxsi Q4 net profit, revenue decline QoQ; firm declares dividend of Rs 70 per share] The net profit was down 4.6 percent quarter-on-quarter co...2 weeks ago
-
Rupee falls 29 paise to close at 82.68 against US dollar - During the day, the rupee touched a high of 82.45 and a low of 82.68 against the greenback. On Friday, the rupee had settled at 82.39 against the dollar.
 11 months ago
 -
-
ES Hourly cloud and 4 Hour chart - - ES Hour moving towards the hourly cloud which may act as resistance. - 4 Hour chart shows a possible bullish candle which may give new high's ...
 2 years ago
 -
JUST NIFTY BLOG 10-01-2020 - Bulk Deals FII DII Stats Date # of Deals Total Volume (In Millions) 01-01-1970 0 0.00 Click here to see all Bulk Deals Date Category Buy Amount (Rs. Cror...4 years ago
-
Vist Note on Federal Bank - We recently met the senior management of Federal Bank which is one of the old private sector banks with a distribution network of 1252 branches (48% Kerala...6 years ago
-
Nifty Bulls bounces ferociously holding 9930,EOD Analysis - FII's bought 4.8 K contract of Index Future worth 262 cores ,9.7 K Long contract were added by FII's and 4.8 K Short contracts were added by FII's. Net Ope...6 years ago
-
Midcap & Smallcap Index Corrects, Lets Come Back To Fundamentals Again - Midcap Index had made a high of 18511 on 16th May 2017, fell almost 7% and is currently trading at 17230. Smallcap Index made all time high of 7679 on 11th...6 years ago
-
Market outlook for 30/10/2016 - *Nifty closed up 22.75 points (0.26%) at 8638.00* while Future closed at 8667.40, premium of 29.40 points. *Bank Nifty closed up 41.35 points (0.21%) at 19...
 7 years ago
 -
Option Open Interest for 28-10-2016 - Inference The index opened flat to positive and after making an initial low around 8581 saw some short covering to close at 8638.00, gain of 22.75 points. ...
 7 years ago
 -
Market Review for 23rd August 2016 - *Nifty (8629)* we said ‘technically trend is still intact but there exists selling pressure near 8746 and support around 8600 zones’ the Nifty unfolded as...7 years ago
-
ITC To Resume Cigarette Manufacturing - ITC manufactures a range of cigarette brands, including India Kings, Classic, Gold Flake, Navy Cut, Capstan, Bristol, Flake, Silk Cut, which are manufactur...8 years ago
-