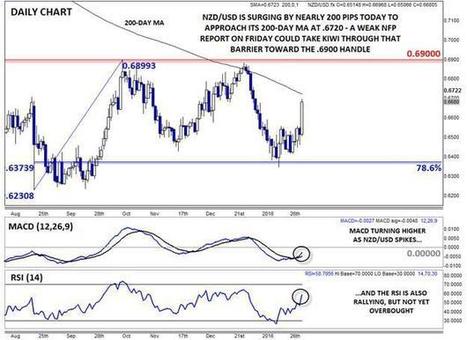
It’s been a disastrous day for the world’s reserve currency: the US Dollar Index is trading down by over 1.5% to a new 3-month low near 97.00 and the greenback is falling against every one of her major rivals.

Ramesh Damani, member of the Bombay Stock Exchange (BSE), expects the upcoming union budget to decide the fate of stock markets in the medium term.
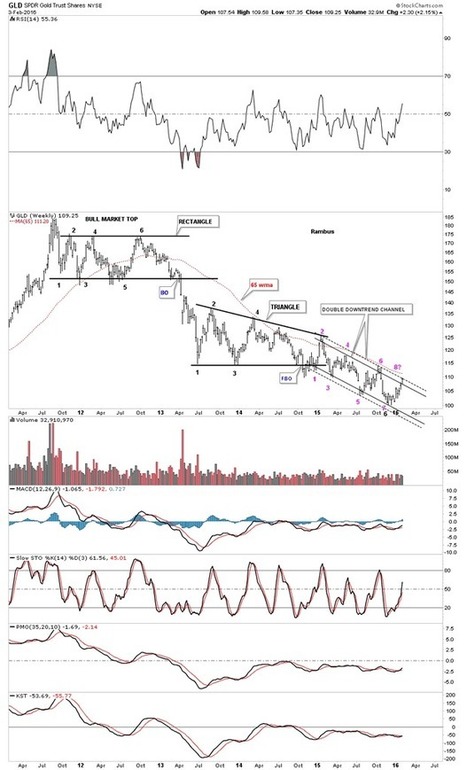
There is alot of action going on this week in all the different areas of the markets. The PM complex has been rallying, the US dollar tanking today and the stock markets trying to make up their mind which way they want to go ...
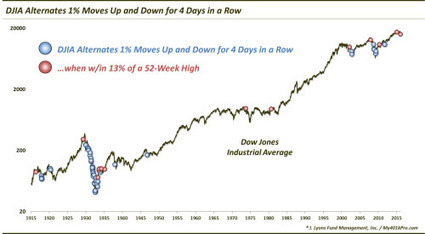
The Dow Jones Industrial Average just alternated 1% moves up and down for 4 days in a row – just the 17th such stretch in the last 70 years. The stock ...
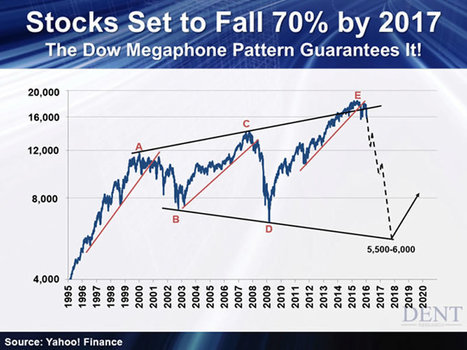
The Next Generational Bust Is Coming, Stock Market 70% Collapse :: The Market Oracle :: Financial Markets Analysis & Forecasting Free Website

On 01 Feb'16, market made a high of 7600.45 & on the consecutive days, we have been seeing continuous weakness.