|
Indicator
|
Weekly Level / Change /
Significance
|
Implication for
S & P 500
|
Implication for Nifty*
|
|
S & P 500
|
2093, -0.69%
|
Bearish
|
Bearish
|
|
Nifty
|
8115, -3.78%
|
Bearish
|
Bearish
|
|
China Shanghai Index
|
5023, 8.92%
|
Bullish
|
Bullish
|
|
Gold
|
1172, -1.57%
|
Bearish
|
Bearish
|
|
WTIC Crude
|
58.88, -2.24%
|
Bearish
|
Bullish
|
|
Copper
|
2.70, -1.21%
|
Bearish
|
Bearish
|
|
Baltic Dry Index
|
610, 3.57%
|
Bullish
|
Bullish
|
|
Euro
|
1.11, 1.02%
|
Bullish
|
Bullish
|
|
Dollar/Yen
|
125.52, 1.11%
|
Bullish
|
Bullish
|
|
Dow Transports
|
8510, 2.53%
|
Bullish
|
Bullish
|
|
US 10 year Bond Yield
|
2.40%, 14.65%
|
Bearish
|
Bearish
|
|
Nyse Summation Index
|
31, -82.27%
|
Bearish
|
Bearish
|
|
US Vix
|
14.21, 2.67%
|
Bearish
|
Bearish
|
|
20 DMA, S and P 500
|
2114, Below
|
Bearish
|
Neutral**
|
|
50 DMA, S and P 500
|
2101, Below
|
Bearish
|
Neutral
|
|
200 DMA, S and P 500
|
2045, Above
|
Bullish
|
Neutral
|
|
20 DMA, Nifty
|
8303, Below
|
Neutral
|
Bearish
|
|
50 DMA, Nifty
|
8395, Below
|
Neutral
|
Bearish
|
|
200 DMA, Nifty
|
8335, Below
|
Neutral
|
Bearish
|
|
India Vix
|
18.09, 8.58%
|
Neutral
|
Bearish
|
|
Dollar/Rupee
|
64.11, 0.58%
|
Neutral
|
Bearish
|
|
|
|
|
|
|
Overall
|
S & P 500
|
Nifty
|
|
|
Bullish Indications
|
6
|
6
|
|
|
Bearish Indications
|
10
|
12
|
|
|
Outlook
|
Bearish
|
Bearish
|
|
|
Observation
|
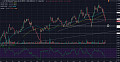
The Sand P 500 is correcting
(support 2085) while the Nifty underperformed significantly last week. The summation
index and treasuries are flashing warning signs.
|
|
|
|
On the Horizon
|
Greece, G7 meetings, US Retail
Sales and PPI
|
|
|
|
|
|
|
|
|
*Nifty
|
India’s
Benchmark Stock Index
|
|
|
|
Raw Data
|
Courtesy
Google finance, Stock charts
|
|
|
|
**Neutral
|
Changes
less than 0.5% are considered neutral
|
|
|

Ahead of the Curve provides you with analysis and insight into today's global financial markets. The latest news and views from global stock, bond, commodity and FOREX markets are discussed.
Featured post
Time Series Analysis with GRETL
This video shows key time-series analyses techniques such as ARIMA, Granger Causality, Co-integration, and VECM performed via GRETL. Key dia...

Saturday, 6 June 2015
Stock Market Signals for the US and Indian Stock Markets for the Upcoming Week beginning June 8
Subscribe to:
Post Comments (Atom)
Market Insight
-
-
Rhumbline Advisers Reduces Position in Clearfield, Inc. (NASDAQ:CLFD) - Rhumbline Advisers lessened its holdings in shares of Clearfield, Inc. (NASDAQ:CLFD – Free Report) by 5.7% during the 1st quarter, according to its most re...1 hour ago
-
Jake Paul Vs. Julio Cesar Chavez Jr. Boxing Undercard - We look at the undercard for the Jake Paul vs. Julio Cesar Chavez Jr. boxing event, featuring a cruiserweight title fight between Gilberto Ramirez and Yuni...1 hour ago
-
Carnival Gears Up For Q2 Print; Here Are The Recent Forecast Changes From Wall Street's Most Accurate Analysts - Latest Ratings for CCL Date Firm Action From To Jan 2022 Jefferies Initiates Coverage On Hold Dec 2021 Goldman Sachs Maintains Neutral Dec 2021 Credit S...2 hours ago
-
Russia Strikes Boeing - Russia’s recent strike on Boeing facilities in Ukraine has been portrayed as an attack on American business. The Dow-listed company has maintained operatio...4 hours ago
-
Closing The Strait Of Hormuz Will Be A Nightmare Scenario For The Global Economy - Our way of life depends on cheap energy. If you remove cheap energy from the equation, our society will be thrown into a state of chaos. The Iranians k...11 hours ago
-
Sunday links: a quiet crackup - Markets - Does it matter if the stock market actually falls 20%? (tker.co) - American households own a lot of stock. (thesandboxdaily.com) - FOM...15 hours ago
-
Report June 22nd - Weekly report covering Gold, Equities, Crude, Dollar. A look at trade opportunities and covering the model portfolio. The post Report June 22nd appeared ...16 hours ago
-
Already In the Thick of World War III | Alexander Dugin - Some people probably think that World War III might pass us by. That’s the "Patrick Syndrome": everything happening around us supposedly doesn’t concern us...
 16 hours ago
 -
10 Sunday Reads - Avert your eyes! My Sunday morning look at incompetence, corruption and policy failures: • Incentivized Stupidity: Stupidity comes in different flavors. ...22 hours ago
-
Debt Rattle June 22 2025 - Rembrandt van Rijn The resurrection of Christ 1639 • Trump: Iran’s Nuclear Facilities “Completely & Totally Obliterated” (ZH) • Trump Hails ‘Spectacula...1 day ago
-
S&P 500 PE Ratio - *Current S&P 500 PE Ratio:* 28.39 -0.16 (-0.55%) 4:00 PM EDT, Fri Jun 202 days ago
-
AST SpaceMobile’s Sky-High Surge: Cosmic Opportunity or Starry-Eyed Hype? - AST SpaceMobile (ASTS) is turning a vision of being able to seamlessly connect your smartphone – even in the remotest corners of the planet – into reali...2 days ago
-
2 Bullish Earnings Calls to Watch as Inflation Lingers - If you've been following company earnings reports, you'll know that inflation is still a hot topic. Here's what to watch next week. The post 2 Bullish Ea...
 2 days ago
 -
Market Dashboard - Subscriber access. To subscribe please visit Market Services on NorthmanTrader.com. Whereas the Daily Market Brief goes into depth on macro and technical c...2 days ago
-
The +500 RASI Might Actually Be Different This Time - [image: nyse ratio-adjusted summation index] The strong breadth since the April 8, 2025 tariff crash low has produced a new all-time high for the NYSE's ...4 days ago
-
How Housing Bubble #2 Bursts - *Corporate / private equity / STVR investors are all fair-weather owners of housing.* *Let's indulge in some basic logic:* 1. All credit-asset bubbles b...4 days ago
-
How Business Insurance Shields Small Companies From Financial Freefall - Small business insurance can mean the difference between keeping your business afloat and having it sink to the bottom.4 days ago
-
The (Uncertain) Payoff from Alternative Investments: Many a slip between the cup and the lip? - It is true that most investing lessons are directed at those who invest only in stocks and bonds, and mostly with long-only strategies. It is also true...
 5 days ago
 -
Trade more markets - we have added 303 cross instruments - We are excited to announce the expansion of our list of trading instruments. It includes a wide selection of cross-currency pairs, as well as crosses on p...6 days ago
-
Imports and trade policy uncertainty - Uncertainty surrounding trade policy can significantly affect International trade flows. Our first FRED graph, above, displays an index of trade policy unc...6 days ago
-
-
Bitcoin’s 200-Day MA Breakout: Trading Crypto in Uncertain Times - As Bitcoin breaks through critical resistance levels, seasoned traders are eyeing both opportunities and warning signs in today’s volatile crypto landsca...1 month ago
-
EV Supply Chain Play: Why Solid Power (SLDP) Could Be a Hidden Gem in Battery Tech - The electric vehicle (EV) revolution is shifting into high gear, and battery technology is at the center of it all. While traditional lithium-ion batteries...3 months ago
-
Climate Change Profiteers Reveal The Democrat Party As A Satanic Death Cult Of Morons - By Barry Ferguson12/10/24The Democrat Party in the US has devolved into a satanic death cult of morons. They not only want to destroy themselves but the re...6 months ago
-
Regency Silver (RSMX.V) – Stock Pick of the Month November 2024 - Our pick for this month is one that picks all of the criteria I like. Before I begin, let me talk about the company. Let me show you what I call my 5 ps of...7 months ago
-
Hello world! - Welcome to WordPress. This is your first post. Edit or delete it, then start writing!1 year ago
-
Weekend Update - Trendline rejection (3/8/24) - SPX was rejected by the blue trendline Friday. The trendline had been sucessfully tested four times and held since November, until now. SPX has unable ...
 1 year ago
 -
Mungerisms: Timeless Wisdom from Charlie Munger on Life and Business - "Mungerisms" are succinct expressions of wisdom and insights coined by Charlie Munger, the Vice Chairman of Berkshire Hathaway and Warren Buffett's longtim...1 year ago
-
It’s Crunch Time for The Daily Doom and Doom Time for The Great Recession Blog - The Great Recession Blog is officially done for good, and my writing continues on TheDailyDoom.com. This site will eventually be completely terminated. If ...1 year ago
-
Innovative Industrial Properties Stock a Great Way to Play Pot Sector - *IIPR Stock Represents a Long-Term Opportunity* Marijuana stocks briefly attracted investors' attention following the 2022 mid-term elections, when Maryl...2 years ago
-
2008 analogue - The 2008 analogue tape looks very interesting from where we stand. Let's anchor it to the next two Fed meetings -- since that's all that matters -- and i...
 2 years ago
 -
Back to trade with Bar Replay - It is often said that one should not be sad about the past, but sometimes it can be nice to return to it. Who would like to buy Tesla for $1 and experience...2 years ago
-
After This Holiday Rally, You Better Know When To Walk Away - This week’s investor insight will make you think twice about the current stock and bond rally as we head into the end of the year. We get a lot of questi...2 years ago
-
How Africa Can Escape Chronic Food Insecurity Amid Climate Change - The toll of extreme weather events on crops underscores the region’s challenges and need for policies to save lives and protect livelihoods.2 years ago
-
12 Bear Market Rules To Live By – Survive & Thrive In The Next Bear Market - 12 Bear Market Rules To Live By – Survive & Thrive In The Next Bear Market [image: Bear Market Rules Survival Guide] I grew up in the 1970s-1980s when th...2 years ago
-
Growth Companies – Getting What You Want - What do the growth companies in your field have in common? How are they doing so well and what can you learn from them? Growth companies usually make a pro...3 years ago
-
-
Blog Post Title - What goes into a blog post? Helpful, industry-specific content that: 1) gives readers a useful takeaway, and 2) shows you’re an industry expert. Use your c...3 years ago
-
Foot Locker Crushed Q2 Earnings Expectations Sending Stock Higher - Plus, AstraZeneca said its antibody therapy reduced the risk of developing COVID-19 symptoms by 77%, The Topps Co’s SPAC merger is off, and Elon Musk annou...3 years ago
-
Elliott Wave Stock Market Update - July 10th - The market has continued its rally to higher highs and it doesn't seem like it wants to stop. We now have a new ATH at 4371 which are NASDAQ levels s...
 3 years ago
 -
The Psychology of QE is Far More Important Than the Amount of It - Let's discuss what QE really does vs the psychology of QE.4 years ago
-
Hello world! - Welcome to WordPress. This is your first post. Edit or delete it, then start writing!4 years ago
-
Market Signals for the US stock market S and P 500 Index and Indian Stock Market Nifty Index for the Week beginning November 09 - Indicator Weekly Level / Change Implication for S & P 500 Implication for Nifty* S & P 500 3509, 7.32% Bullish Bullish Nifty 12264, 5.34% Neutral ** Bullis...4 years ago
-
Fully Automated Trend Trading w/ Stocks Or Options - There’s a lot of research to support the usage of trend indicators as simple risk reduction elements that can be layered onto an existing strategy. Howev...4 years ago
-
2020 Top Investment Picks – Q3 Update - At the beginning of the year, I put together a list of Top Investment Picks for 2020 from the investment community and track them on this website. This is ...4 years ago
-
The last of 12326 - February 22nd 2012..... First post... https://permabeardoomster.blogspot.com/2012/02/can-anyone-fly-plane.html -- This post will be the last under the o...
 4 years ago
 -
-
Ultramarathoner Runs Over 200 Miles in Backyard, Wins Golden Toilet Paper Roll - Strange times indeed. In the land “BC,” before coronavirus, people ran long distances in foot races, and toilet paper wasn’t coveted. Things have changed. ...5 years ago
-
March report "How Revolutions, Wars and Plagues are Harbingers of 'Great Changes' in Societies and in Economics" published. http://bit.ly/2y4LJZQ - March report "How Revolutions, Wars and Plagues are Harbingers of 'Great Changes' in Societies and in Economics" published.https://t.co/k29bzcK3DY — Marc ...5 years ago
-
Weekend Report - Weekend Report Provided by the OEW Group December 21, 2019 Last Monday started with a sharp rally on positive trade news. After closing at 3169 the previou...5 years ago
-
Financial Markets Will Move To Asia - Chicago, they invented the Soybean futures contracts. But now, China uses more soybeans than ... *READ THE REST OF THE ARTICLE ON THE NEW WEBSITE: JIM ROGE...
 5 years ago
 -
GW Pharmaceuticals (GWPH) Signals Bearish Continuation To $100 -
GW Pharmaceuticals $GWPH has been retreating sharply, and might have further downside towards $100.
G...
5 years ago -
Meet Hert Capital and How He Uses Stocktwits - On Stocktwits, HertCapital has been known for quite some time. But for those reading who haven’t had a chance to follow him, we asked him a few questions...5 years ago
-
The Earnings Mirage: Why Corporate Profits are Overstated and What it Means for Investors - I just published a new long-form piece through OSAM Research Partners entitled “The Earnings Mirage: Why Corporate Profits are Overstated and What it Means...5 years ago
-
Nightly Algo Report – December 6, 2018 - To access this post, you must purchase Premium Plan or Premium Plan - Annual. The post Nightly Algo Report – December 6, 2018 appeared first on Elliottwa...6 years ago
-
Don’t be Fooled by the Pullback in the Dollar Because…. - Don’t be fooled by the pullback in the U.S. dollar today because the greenback could still strengthen further before the end of the year. Nearly all of the...6 years ago
-
Weekly Videos - This week’s video will be posted on the new home for Short Takes. If all goes well, it will appear sometime between 6:00 and 8:00 pm ET.7 years ago
-
Gold’s silent comeback and the middle class rebound - The middle class has been stuck in a rut – psychologically if not economically – for years, and they’re not afraid to admit it. Last year’s upset victory...
 7 years ago
 -
Kafka For The Twenty First Century - I've been spending a slightly frustrating day trying to update my payment details at google. To log in to my admin console I need to log in using my G Sui...
 8 years ago
 -
The Progressive Case for Abolishing the Corporate Income Tax - Reform of the corporate income tax is shaping up to be one of the big issues facing Congress in 2017. Republicans are pushing for big cuts in the corpora...8 years ago
-
Gold Unleashed by Fed - Gold's next major upleg was likely unleashed by a very-dovish FOMC this week, which now has its hands tied on hiking rates or being hawkish due to the US e...8 years ago
-
From false moves… - One of my favorite sayings came from my trader friend Brian Shannon, who said from false moves come fast moves. I always pay attention to […] The post Fr...11 years ago
-
Why Mitt Romney Will Be The Next President - News Flash: Despite how it may look, what with Occupy Wall Street protests and Tea Party rallies, the country’s populous is not as polarized as it might se...13 years ago
-
August 24th Blogger Sentiment Poll - There are more bulls than bears in this week's poll. Blogger Sentiment Poll Participants: 24/7 Wall St (N) Carl Futia (+) Dash of Insight (+) Elliot Wave L...15 years ago


Forex Insight
-
German Preliminary Manufacturing PMI rises to 49 in June as expected - Read more on https://www.fxstreet.com1 hour ago
-
Asia mid-session: Geopolitical tensions spark risk-off moves - Geopolitical tensions surged after US President Trump authorized airstrikes on Iranian nuclear sites, reversing his earlier call for diplomacy. Risk-off se...2 hours ago
-
Event Guide: Canada’s CPI Report (May 2025) - Geopolitics may dominate the headlines, but Canada’s CPI could move CAD pairs. With the BOC debating its next step, a hot inflation read might squash rat...2 hours ago
-
Upward Revision to Q2 GDP Aids the US Dollar’s Feeble Recovery - The second estimate of US GDP growth in Q2 saw an upward revision from 2.8% to 3%. However, US resilience has come under pressure, particularly in the labo...9 months ago
-
Don’t be Fooled by the Pullback in the Dollar Because…. - Don’t be fooled by the pullback in the U.S. dollar today because the greenback could still strengthen further before the end of the year. Nearly all of the...6 years ago
-
EUR/USD Weekly Outlook - EUR/USD's decline attempt was contained at 1.0494, above 1.0493 support and rebounded. Initial bias stays neutral this week first. On the upside, break of ...8 years ago
-
Loonie and Aussie Share Downward Bond - In yesterday’s post (Tide is Turning for the Aussie), I explained how a prevailing sense of uncertainty in the markets has manifested itself in the form of...13 years ago
India Market Insight
-
Key Bank Nifty Weekly Levels to Watch After the US Strike on Iran Nukes - Weekly Astro-Trading Forecast: 23–29 June 2025 “When the cosmos speaks in patterns, markets respond in trends. The key is knowing when to listen.” – Gann...5 hours ago
-
Reduce Persistent Systems; target of Rs 3700: Emkay Global Financial - [image: Reduce Persistent Systems; target of Rs 3700: Emkay Global Financial] Emkay Global Financial recommended reduce rating on Persistent Systems with a...1 year ago
-
Rupee falls 29 paise to close at 82.68 against US dollar - During the day, the rupee touched a high of 82.45 and a low of 82.68 against the greenback. On Friday, the rupee had settled at 82.39 against the dollar.
 2 years ago
 -
-
JUST NIFTY BLOG 10-01-2020 - Bulk Deals FII DII Stats Date # of Deals Total Volume (In Millions) 01-01-1970 0 0.00 Click here to see all Bulk Deals Date Category Buy Amount (Rs. Cror...5 years ago
-
Gold Top down analysis. - - Updating blog after a long Gap. Longest in the last 8 years. May not be able to update regularly for 2 more months to come. - Gold bulls co...
 6 years ago
 -
Vist Note on Federal Bank - We recently met the senior management of Federal Bank which is one of the old private sector banks with a distribution network of 1252 branches (48% Kerala...7 years ago
-
Bank Nifty does Price Time Squaring and gave big move - As discussed in Last Analysis Bank Nifty gave the big move as we were expecting near turn date and also made low of 24706 near our target of 24700 and bo...7 years ago
-
Midcap & Smallcap Index Corrects, Lets Come Back To Fundamentals Again - Midcap Index had made a high of 18511 on 16th May 2017, fell almost 7% and is currently trading at 17230. Smallcap Index made all time high of 7679 on 11th...8 years ago
-
Market outlook for 28/10/2016 - *Nifty closed flat at 8615.25* while Future closed at 8655.25, premium of 40.00 points. *Bank Nifty closed up 31.00 points (0.16%) at 19514.60* while Futur...
 8 years ago
 -
Option Open Interest for 27-10-2016 - Inference The index opened flat and went down to touch the lows at 8550, but support level buying saw the index close flat at 8615.25. The broader market w...
 8 years ago
 -
NIFTY OUTLOOK FOR 22-8-16 - *Nifty (8667)* we said ‘it is quite possible that the Nifty may open again in the green but I would be cautious in the upper regions’ the Nifty opened in ...8 years ago
-
ITC To Resume Cigarette Manufacturing - ITC manufactures a range of cigarette brands, including India Kings, Classic, Gold Flake, Navy Cut, Capstan, Bristol, Flake, Silk Cut, which are manufactur...9 years ago
-
No comments:
Post a Comment