
Global financial markets enter late August in a consolidation phase as investors weigh geopolitical friction in commodity channels against shifting central bank interest rate expectations. Capital flows reflect a tug-of-war between elevated U.S. Treasury yields and range-bound equity valuations ahead of major economic policy keynotes.
Global Macro & Geopolitical Drivers
- Interest
Rates: The U.S. Federal Reserve maintains its
policy target range at 3.50%–3.75%, while the U.S. 10-Year Treasury yield
trades near 4.71%, maintaining structural valuation pressure on
high-multiple growth equities.
- Exchange
Rates: The U.S. Dollar Index (DXY) has
moderated to 98.83 following softer labor market data, granting modest
relief to emerging market currencies and supporting EUR/USD near $1.17.
- Commodity
Prices: Brent crude trades around $94.24 per
barrel after gaining 6% week-over-week, driven by shipping bottlenecks and
geopolitical friction.
- Geopolitics: Maritime security risks near the Strait of Hormuz continue to
inject a persistent risk premium into global energy benchmarks.
|
Asset / Metric |
Current Level |
Technical & Macro Signal |
|
S&P 500 Index |
~7,680.17 |
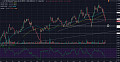
Tight consolidation; 50-period (7,683) and 200-period (7,687) MAs
tightly compressed. |
|
US 10-Yr Yield |
~4.71% |
Elevated yield environment keeps equity risk premiums tight. |
|
DXY Index |
~98.83 |
Softening trend eases foreign exchange pressure on international trade
balances. |
|
Brent Crude |
~$94.24 / bbl |
Testing multi-month highs; poses secondary upside risks to headline
inflation. |
Valuations & Technical Outlook
- Moving
Average Compression: Short-term technicals
on the S&P 500 show the 50-period moving average (7,683.28) and
200-period moving average (7,687.92) stacked within five points of each
other, signaling an impending volatility squeeze once macro direction
clarifies.
- Momentum
Realignment: Momentum indicators have normalized,
with the Relative Strength Index (RSI) cooling from overbought conditions
down to ~45.64.
- Valuation
Headwinds: Multiples remain sensitive to yield
fluctuations, requiring sustained corporate earnings growth to support
current equity levels.
Primary Risks
- Prolonged
maritime standoffs escalating crude prices above $95/bbl.
- Hawkish
monetary surprises driving long-term Treasury yields toward key multi-year
resistance levels.
Global Market Snapshot
|
Asset Class |
Weekly
Level / Change |
Implications
for S&P 500 |
Implications for Nifty* |
|
S&P
500 |
7674, -1.43% |
Bearish |
Bearish |
|
Nifty |
24252, -0.47% |
Neutral
** |
Neutral |
|
China
Shanghai Index |
3905, -0.56% |
Bearish |
Bearish |
|
Gold |
4662, 5.05% |
Bullish |
Bullish |
|
WTIC
Crude |
86.64, 5.15% |
Bullish |
Bullish |
|
Copper |
6.58, -0.50% |
Bearish |
Bearish |
|
CRB Index |
406, 3.79% |
Bullish |
Bullish |
|
Baltic
Dry Index |
2841, -0.77% |
Bearish |
Bearish |
|
Euro |
1.1677, 0.92% |
Bullish |
Bullish |
|
Dollar/Yen |
158.98, -0.21% |
Neutral |
Neutral |
|
Dow
Transports |
21570, -1.02% |
Bearish |
Neutral |
|
Corporate
Bonds (ETF) |
105.92, -0.19% |
Neutral |
Neutral |
|
High-Yield
Bonds (ETF) |
95.87, -0.10% |
Neutral |
Neutral |
|
US
10-year Bond Yield |
4.74%, 0.89% |
Bearish |
Bearish |
|
NYSE
Summation Index |
226, -24.00% |
Bearish |
Neutral |
|
US Vix |
15.13, 6.18% |
Bearish |
Neutral |
|
S&P
500 Skew |
144 |
Bearish |
Neutral |
|
CNN Fear
& Greed Index |
Neutral |
Neutral |
Neutral |
|
Nifty MMI
Index |
Fear |
Neutral |
Bullish |
|
20 DMA,
S&P 500 |
7644, Above |
Bullish |
Neutral |
|
50 DMA,
S&P 500 |
7541, Above |
Bullish |
Neutral |
|
200 DMA,
S&P 500 |
7096,
Above |
Bullish |
Neutral |
|
20 DMA,
Nifty |
24371, Below |
Neutral |
Bearish |
|
50 DMA,
Nifty |
24182, Above |
Neutral |
Bullish |
|
200 DMA,
Nifty |
24693,
Below |
Neutral |
Bearish |
|
S&P
500 P/E |
29.58 |
Bearish |
Neutral |
|
Nifty P/E |
20.50 |
Neutral |
Bearish |
|
India Vix |
11.20, -0.97% |
Neutral |
Bullish |
|
Dollar/Rupee |
95.73, 0.30% |
Neutral |
Neutral |
|
Overall |
S&P
500 |
Nifty |
|
|
Bullish
Indications |
7 |
7 |
|
|
Bearish
Indications |
10 |
8 |
|
|
Outlook |
Bearish |
Bearish |
|
|
Observation |
The
S&P500 and the Nifty fell last week. Indicators are bearish for the
week. Markets are topping. Watch those stops. |
||
|
On the
Horizon |
Eurozone – German GDP, US - GDP |
||
|
*Nifty |
India’s
Benchmark Stock Market Index |
||
|
Raw Data |
Data
courtesy stockcharts.com, investing.com, multpl.com, nseindia.com,
tickertape.in, forexfactory.com |
||
|
**Neutral |
Changes
less than 0.5% are considered neutral |

The past week saw US equity markets fall. Most emerging markets rose despite a rising interest-rate environment. Transports fell. The Baltic Dry fell. The dollar fell. Most commodities rose. Valuations are expensive, market breadth fell, and sentiment is neutral. Volatility (S&P 500) rose. The market is forming an important top.
The critical levels to watch for
the week are 7685 (up) and 7660 (down) on the S&P 500 and 24350 (up) and 24150
(down) on the Nifty. A significant breach of the
above levels could trigger the next major move in these markets. High
beta/P/E will get torched again and is a sell on every rise. Gold
increasingly looks like the asset class to own over the next decade. Gold
exploded, rising almost eightfold over the decade following the dot-com bust in
2000. Imagine what would happen to gold when this AI bubble bursts. You
can check out last week’s report for a comparison. I love your thoughts and
feedback.
About the Author
Dr. Rajveer S. Rawlin holds a PhD and an MBA in Finance and serves
as an Associate Professor at CHRIST University. He has tracked capital markets
in both the US and India since 1993, specializing in macroeconomic cycles,
banking profitability metrics, and econometric investment analysis.
References & Sources
· Vantage Markets
– Daily Trading: S&P 500 Analysis & Moving Average Squeeze (Aug 24,
2026).
· Sahi Finance –
US 10-Year Treasury Yields & Emerging Market Impact (Aug 19, 2026).
· IG UK – Brent
Crude Nears $94: Hormuz Standoff Dynamics (Aug 24, 2026).
· StreetStats –
Foreign Exchange Rates & DXY Index Metrics (Aug 21, 2026).
· Cambridge
Currencies – US Dollar Index (DXY) 2026 Macro Outlook (Aug 12, 2026).
Disclaimer: The views expressed in this post are
strictly for educational and informational purposes and do not constitute
financial or investment advice. Always conduct independent research before
making market decisions.










No comments:
Post a Comment