
Global equity markets enter mid-August navigating shifting central bank policy expectations, renewed commodity price spikes driven by geopolitical friction, and elevated mega-cap valuations. While benchmark indexes continue to print record highs, underlying breadth and fixed-income market moves reflect underlying investor caution across asset classes.
Global equity markets closed mid-August near historic highs,
navigating a complex web of rising geopolitical friction, recalibrated monetary
expectations, and high mega-cap valuations. While benchmark indexes continue to
show broad structural resilience, underlying fixed-income volatility and
commodity price spikes highlight growing investor defensiveness across global
asset classes.
Global
Macro Trends & Central Bank Dynamics
·
U.S.
Treasury Yields & Monetary Expectations: The benchmark U.S. 10-year Treasury yield finished the week at
4.68%–4.69%, while the 2-year yield settled at 4.17%. Bond markets continue to digest mixed
inflation signals (3.5% YoY headline CPI) alongside persistent U.S. fiscal
borrowing needs.
·
U.S.
Dollar Index (DXY): The
DXY consolidated around 99.9, oscillating within its recent consolidation range
as yield differentials rebalance.
·
Foreign
Exchange Markets: The
Euro (EUR/USD) traded near 1.1500, the British Pound (GBP/USD) held steady at
1.3500, and the Japanese Yen (USD/JPY) traded near 159.30, reflecting
persistent rate differentials between Western central banks and the Bank of
Japan.
Geopolitics
& Commodity Pressures
·
Energy
Markets: Brent crude oil surged
to $88.52 per barrel (+1.67% daily, logging a ~5% weekly gain), while WTI crude
advanced to $82.40 per barrel.
Escalating
naval friction surrounding Iran and threats of extended blockades near the
Strait of Hormuz sparked severe energy supply premiums, overriding pressure
from weaker short-term demand metrics.
·
Safe-Haven
Metals: Physical spot
gold (XAU/USD) traded between $4,364.96 and $4,410.00 per ounce, holding near
recent highs after reaching an all-time peak of $4,434.84. Central bank reserve
diversification and geopolitical risk hedging continue to provide a firm floor
for precious metals.
Valuations
& Technical Analysis
·
Equity
Multiples: The S&P 500 forward
12-month P/E ratio sits at approximately 28x earnings, significantly above its
5-year average of 24x.
High multiples remain anchored by aggressive capital expenditures in artificial
intelligence infrastructure and double-digit corporate profit expansion.
·
Technical
Levels: The S&P 500
closed the week at 7,785.76, following a new intraday record high of 7,816.70
on August 13. Immediate overhead technical resistance is established at 7,820,
with primary support anchored between 7,710–7,730 and secondary support at 7,530.
Key
Future Risks
·
High
Corporate Earnings Expectations:
Wall
Street has priced in aggressive corporate performance, with FactSet projecting
22% annualized S&P 500 earnings growth through 2027. Any quarterly earnings
misses or a reduction in AI capital expenditure guidance could trigger sharp
valuation contractions.
·
Sticky
Inflation & Rate Path Uncertainty:
With 10-year yields anchored near 4.70%, persistent structural inflation could
prevent central banks from easing rates as rapidly as equity markets
anticipate, tightening global financial conditions.
·
Energy
Supply Chokepoint Risks:
Continued escalation around maritime chokepoints like the Strait of Hormuz
poses the risk of a secondary oil price surge above $95/bbl, which would
directly reignite global headline inflation.
·
2026
U.S. Midterm Election Volatility:
Shifting political dynamics, proposed tax policy alterations, and trade
regulatory shifts leading into the November midterm elections introduce
heightened macroeconomic uncertainty for institutional portfolios.
Global Market Snapshot
|
Asset Class |
Weekly
Level / Change |
Implications
for S&P 500 |
Implications for Nifty* |
|
S&P
500 |
7786, 0.36% |
Neutral |
Neutral |
|
Nifty |
24366, -0.83% |
Neutral
** |
Bearish |
|
China
Shanghai Index |
3927, -0.33% |
Neutral |
Neutral |
|
Gold |
4432, 0.73% |
Bullish |
Bullish |
|
WTIC
Crude |
81.47, 4.21% |
Bullish |
Bullish |
|
Copper |
6.61, 0.29% |
Neutral |
Neutral |
|
CRB Index |
391, 2.78% |
Bullish |
Bullish |
|
Baltic
Dry Index |
2863, -6.35% |
Bearish |
Bearish |
|
Euro |
1.1570, 0.10% |
Neutral |
Neutral |
|
Dollar/Yen |
159.32, 0.96% |
Bullish |
Bullish |
|
Dow
Transports |
21792, 1.33% |
Bullish |
Neutral |
|
Corporate
Bonds (ETF) |
106.12, -0.40% |
Neutral |
Neutral |
|
High-Yield
Bonds (ETF) |
95.97, 0.17% |
Neutral |
Neutral |
|
US
10-year Bond Yield |
4.70%, 0.82% |
Bearish |
Bearish |
|
NYSE
Summation Index |
298, 10.00% |
Bullish |
Neutral |
|
US Vix |
14.25, -4.36% |
Bullish |
Neutral |
|
S&P
500 Skew |
138 |
Neutral |
Neutral |
|
CNN Fear
& Greed Index |
Greed |
Bearish |
Neutral |
|
Nifty MMI
Index |
Greed |
Neutral |
Bearish |
|
20 DMA,
S&P 500 |
7585, Above |
Bullish |
Neutral |
|
50 DMA,
S&P 500 |
7512, Above |
Bullish |
Neutral |
|
200 DMA,
S&P 500 |
7075,
Above |
Bullish |
Neutral |
|
20 DMA,
Nifty |
24323, Above |
Neutral |
Bullish |
|
50 DMA,
Nifty |
24084, Above |
Neutral |
Bullish |
|
200 DMA,
Nifty |
24736,
Below |
Neutral |
Bearish |
|
S&P
500 P/E |
30.00 |
Bearish |
Neutral |
|
Nifty P/E |
20.56 |
Neutral |
Bearish |
|
India Vix |
11.31, -6.99% |
Neutral |
Bullish |
|
Dollar/Rupee |
95.65, 0.46% |
Neutral |
Neutral |
|
Overall |
S&P
500 |
Nifty |
|
|
Bullish
Indications |
10 |
7 |
|
|
Bearish
Indications |
5 |
6 |
|
|
Outlook |
Bullish |
Bullish |
|
|
Observation |
The
S&P500 rose, and the Nifty fell last week. Indicators are bullish for the
week. Markets are topping. Watch those stops. |
||
|
On the
Horizon |
Eurozone – CPI, UK – CPI, Japan - GDP |
||
|
*Nifty |
India’s
Benchmark Stock Market Index |
||
|
Raw Data |
Data
courtesy stockcharts.com, investing.com, multpl.com, nseindia.com,
tickertape.in, forexfactory.com |
||
|
**Neutral |
Changes
less than 0.5% are considered neutral |

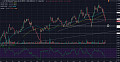
The past week saw US equity markets rise. Most emerging markets rose despite a rising interest-rate environment. Transports rose. The Baltic Dry fell. The dollar was unchanged. Most commodities rose. Valuations are expensive, market breadth rose, and sentiment is greedy. Volatility (S&P 500) fell. The market is forming an important top.
The critical levels to watch for
the week are 7800 (up) and 7770 (down) on the S&P 500 and 24450 (up) and 24300
(down) on the Nifty. A significant breach of the
above levels could trigger the next major move in these markets. High
beta/P/E will get torched again and is a sell on every rise. Gold
increasingly looks like the asset class to own over the next decade (currently
in a correction). Gold exploded, rising almost eightfold over the decade
following the dot-com bust in 2000. Imagine what would happen to gold when this
AI bubble bursts. You can check out last week’s report for a comparison. I love your thoughts and
feedback.
About the Author
Dr. Rajveer S. Rawlin holds a PhD and an MBA in Finance and serves
as an Associate Professor at CHRIST University. He has tracked capital markets
in both the US and India since 1993, specializing in macroeconomic cycles,
banking profitability metrics, and econometric investment analysis.
References & Sources
· Investing.com & S&P Dow Jones
Indices (Aug 14, 2026):
S&P
500 Historical Data (7,785.76 Close / 7,816.70 All-Time High).
· ETF Database & U.S. Department of
the Treasury (Aug 14, 2026):
Treasury
Yield Snapshot (10-Year at 4.68%, 2-Year at 4.17%).
· FactSet Research & Hindustan Times
Business (Aug 11, 2026):
S&P
500 P/E Ratios (28x vs 24x 5-Year Average) & Earnings Growth Outlook.
· Trading Economics & ICE (Aug 14,
2026): Brent Crude Oil
($88.52/bbl) and WTI Crude ($82.40/bbl) spot prices.
· HDFC SKY & Oilprice.com (Aug 14,
2026): Middle East
Geopolitical Risks & Strait of Hormuz Supply Impact.
Disclaimer: The views expressed in this post are
strictly for educational and informational purposes and do not constitute
financial or investment advice. Always conduct independent research before
making market decisions.










No comments:
Post a Comment