Global financial markets enter late September navigating a shifted macro regime following the Federal Reserve's monetary policy adjustment, persistent geopolitical risk in West Asia, and a re-testing of key technical resistance levels across major equity benchmarks. As interest rate differentials widen and commodity prices face renewed supply-side friction, investors are balancing elevated equity valuations against rising fixed-income yields.
Market Dashboard &
Asset Class Summary
|
Asset Class /
Benchmark |
Current Level /
Range |
Weekly Trend |
Macro &
Technical Catalyst |
|
S&P
500 (SPX) |
7,650.50 |
Neutral / Consolidation |
Tech resilience vs. pressure from 5% 10-year
Treasury yields. |
|
Dow
Jones Industrial Average |
51,682.64 |
Bearish Bias |
Dragged lower by industrial and rate-sensitive
financial components. |
|
Nasdaq
Composite |
26,522.55 |
Mild Bullish |
Outperformance in AI-linked megacap technology
platforms. |
|
STOXX
Europe 600 |
635.45 |
Bearish Bias |
Down 0.57% weekly on elevated energy costs and
industrial softness. |
|
US
10-Year Treasury Yield |
4.98% – 5.00% |
Bullish Yields |
Expanding fiscal debt supply and Fed rate hike to
3.75%–4.00%. |
|
US
Dollar Index (DXY) |
100.22 – 100.25 |
Range-bound |
Hawkish Fed stance offset by broader currency basket
adjustments. |
|
Brent
Crude Oil |
$100.20 / bbl |
High Volatility |
Strait of Hormuz supply concerns tempered by
US-China trade talks. |
|
Spot
Gold (XAU/USD) |
$4,350 / oz |
Bullish Consolidation |
Sustained flight-to-safety demand and central bank
accumulation. |
1. Global Macro Dynamics: Interest
Rates & Currencies
Federal Reserve Policy
Decision
On September 16, 2026, the Federal Open Market Committee
(FOMC) unanimously voted to raise the benchmark Federal Funds target rate by 25
basis points to a range of 3.75%–4.00%.
- Yield
Curve Strain:
The US 10-Year Treasury yield surged toward the 5.00%
mark (trading at 4.98%), matching its highest level in several years.
The spike in yields has been amplified by expanding US sovereign debt issuance and Treasury buyback operations.
- Foreign
Exchange Impact:
The US Dollar Index (DXY) consolidated near 100.22.
The greenback continues to draw yield support, keeping emerging market currencies under minor devaluation pressure.
Global
Central Bank Divergence
- Bank of England (BoE): Held its
policy rate steady at 3.75% in a 6–3 vote, while detailing plans to pause
active gilt sales for six months to stabilize UK bond markets.
- Bank of Japan (BoJ): The Yen traded around USD/JPY 155.90–156.88 as markets
price in incremental rate adjustments toward 1.25%, keeping traders alert
to potential Japanese yen carry-trade unwinding.
2. Commodities & Energy Sector
Analysis
Crude Oil Dynamics
Brent
Crude futures consolidated near $100.20 per barrel after touching multi-month
highs above $101/bbl.
- Supply Disruptions: Persian Gulf shipping bottlenecks and transport
disruptions through the Strait of Hormuz have kept an energy risk premium
priced into crude.
- Demand Buffer: Reports of
Saudi Arabia seeking alternative route flows via its East-West pipeline,
alongside ongoing high-level diplomatic talks between Washington and
Beijing, provided a modest price cap early in the week.
Precious Metals &
Gold
- Spot Gold ($XAU/USD$): Gold trades near $4,350 per troy ounce,
recovering quickly from post-FOMC rate shock sell-offs.
Inflation hedging and systemic risk protection continue to anchor bullion near historical highs, with gold futures trading near $4,425/oz.
3. Geopolitical Risk & Supply
Chain Landscape
- US-China High-Level Trade
Diplomacy:
High-stakes bilateral discussions between US Treasury Secretary Scott
Bessent and Chinese Vice Premier He Lifeng in New York yielded positive
preliminary sentiment.
Focus turns to a potential summit between US and Chinese leadership covering artificial intelligence, trade tariffs, and supply chain security.
- Middle East & Transit
Corridors:
Energy flows through the Persian Gulf and Red Sea remain subject to
heightened maritime security protocols, maintaining elevated freight
insurance rates for Asia-Europe trade routes.
4. Valuation Landscape & Equity
Multiples
Global equity markets
reflect significant valuation dispersion across geographical regions:
Regional
Valuation Overview (Forward P/E Ratios):
--------------------------------------------------
S&P
500 (US): 21.8x (Historical Avg: 16.8x)
STOXX
Europe 600: 13.5x (Historical Avg: 14.1x)
MSCI
Emerging Markets: 12.3x (Historical Avg: 12.5x)
Japan
TOPIX: 14.6x (Historical Avg: 15.0x)
- US Equity Multiples: The S&P
500 forward P/E ratio remains rich relative to long-term averages.
Elevated discount rates (5% Treasury yields) create valuation headwinds
for long-duration equities, though core technology platforms continue to
deliver robust return on invested capital.
- European Discount: STOXX Europe
600 trades at 13.5x forward earnings, offering higher dividend yields but
constrained by sluggish regional manufacturing growth.
5. Technical Outlook & Key Chart
Levels
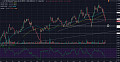
S&P 500 Index (SPX)
- Trend: Broad
primary uptrend encountering secondary resistance near all-time high
territories.
- Support Levels:
- Immediate Support: 7,629 – 7,636
(Recent swing lows)
- Secondary Support: 7,550 (50-day
moving average zone)
- Resistance Levels:
Primary Resistance: 7,684 (50-period
      short-term moving average)
- Key Overhead
Target: 7,720
(Record high resistance)
7,720 +---------------------------------
[All-Time High Resistance]
| /\ /\
7,684 |
/\ /\ /
\ /\ / \
<-- 50-Period MA Resistance
|
/ \/ \/
\/ V \
<-- Current Level (~7,650.50)
7,636 +---/-------------------------\---
[Immediate Swing Support]
|
/
7,550 +-/-------------------------------
[50-Day Moving Average]
STOXX Europe 600 (SXXP)
- Trend: Weakness over three consecutive weeks, settling at
635.45.
- Technical View: A breakdown below 629.40 (1-month low) would test
long-term trend support near 620.00, whereas overhead resistance stands
firm at 644.40.
6. Strategic Portfolio Action Plan
Based on current
macroeconomic constraints and yield dynamics:
- Rebalance Fixed-Income
Allocations:
Reallocate a portion of cash reserves into 2-year to 5-year short-duration
sovereign Treasuries to capture yields approaching 5.00%.
- Hedge Energy Exposure: Maintain a
3%–5% portfolio baseline allocation to energy sector equities or spot gold
($XAU/USD$) near
$4,350/oz as a hedge against Middle East geopolitical developments.
- Set Disciplined Equity Stops: Implement
trailing stop-loss thresholds (e.g., 3% below entry) on high-beta
technology holdings to protect capital against potential rate-driven
multiple compression.
Global Market Snapshot
|
Asset Class |
Weekly
Level / Change |
Implications
for S&P 500 |
Implications for Nifty* |
|
S&P
500 |
7651, -0.08% |
Neutral |
Neutral |
|
Nifty |
23346, -0.22% |
Neutral
** |
Neutral |
|
China
Shanghai Index |
3912, 0.61% |
Bullish |
Bullish |
|
Gold |
4416, 0.63% |
Bullish |
Bullish |
|
WTIC
Crude |
96.08, -3.97% |
Bearish |
Bearish |
|
Copper |
6.72, 2.63% |
Bullish |
Bullish |
|
CRB Index |
423, -0.13% |
Neutral |
Neutral |
|
Baltic
Dry Index |
3370, -3.91% |
Bearish |
Bearish |
|
Euro |
1.1486, -0.98% |
Bearish |
Bearish |
|
Dollar/Yen |
156.88, 2.17% |
Bullish |
Bullish |
|
Dow
Transports |
20079, -2.66% |
Bearish |
Neutral |
|
Corporate
Bonds (ETF) |
104.70, 0.36% |
Neutral |
Neutral |
|
High-Yield
Bonds (ETF) |
94.55, -0.06% |
Neutral |
Neutral |
|
US
10-year Bond Yield |
5.00%, 0.42% |
Neutral |
Neutral |
|
NYSE
Summation Index |
-369, -168.00% |
Bearish |
Neutral |
|
US Vix |
14.81, -6.50% |
Bullish |
Neutral |
|
S&P
500 Skew |
148 |
Bearish |
Neutral |
|
CNN Fear
& Greed Index |
Fear |
Bullish |
Neutral |
|
Nifty MMI
Index |
Extreme Fear |
Neutral |
Bullish |
|
20 DMA,
S&P 500 |
7659, Below |
Bearish |
Neutral |
|
50 DMA,
S&P 500 |
7617, Above |
Bullish |
Neutral |
|
200 DMA,
S&P 500 |
7183,
Above |
Bullish |
Neutral |
|
20 DMA,
Nifty |
23789, Below |
Neutral |
Bearish |
|
50 DMA,
Nifty |
24079, Below |
Neutral |
Bearish |
|
200 DMA,
Nifty |
24494,
Below |
Neutral |
Bearish |
|
S&P
500 P/E |
26.07 |
Bearish |
Neutral |
|
Nifty P/E |
19.74 |
Neutral |
Neutral |
|
India Vix |
11.39, -7.33% |
Neutral |
Bullish |
|
Dollar/Rupee |
96.06, 0.53% |
Neutral |
Bearish |
|
Overall |
S&P
500 |
Nifty |
|
|
Bullish
Indications |
8 |
6 |
|
|
Bearish
Indications |
8 |
7 |
|
|
Outlook |
Neutral |
Bearish |
|
|
Observation |
The
S&P500 and the Nifty were unchanged last week. Indicators are mixed for
the week. Markets are topping. Watch those stops. An oversold bounce
first. |
||
|
On the
Horizon |
|||
|
*Nifty |
India’s
Benchmark Stock Market Index |
||
|
Raw Data |
Data
courtesy stockcharts.com, investing.com, multpl.com, nseindia.com,
tickertape.in, forexfactory.com |
||
|
**Neutral |
Changes
less than 0.5% are considered neutral |

The past week saw US equity
markets unchanged. Most emerging markets fell amid rising interest rates.
Transports fell. The Baltic Dry fell. The dollar was rose. Most commodities rose.
Valuations are expensive, market breadth fell, and sentiment is fearful.
Volatility (S&P 500) fell. The market is forming an important top and
getting ready for the September/October swoon, but first, an oversold bounce is
overdue.
The critical levels to watch for
the week are 7665 (up) and 7640 (down) on the S&P 500 and 23450 (up) and 23250
(down) on the Nifty. A significant breach of the
above levels could trigger the next major move in these markets. High
beta/P/E will get torched again and is a sell on every rise. Gold
increasingly looks like the asset class to own over the next decade. Gold
exploded, rising almost eightfold over the decade following the dot-com bust in
2000. Imagine what would happen to gold when this AI bubble bursts. You
can check out last week’s report for a comparison. I love your thoughts and
feedback.
About the Author
Dr. Rajveer S. Rawlin holds a PhD and an MBA in Finance and serves
as an Associate Professor at CHRIST University. He has tracked capital markets
in both the US and India since 1993, specializing in macroeconomic cycles,
banking profitability metrics, and econometric investment analysis.
References
& Sources
Federal Reserve System: FOMC Statement & Policy Rate Target
Range (3.75%–4.00%), September 16, 2026.
St. Louis Fed (FRED): 10-Year Constant Maturity
Treasury Yield Data (DGS10).
Standard Chartered Market
Outlook: Daily
Navigator: FX, Interest Rate Path & BoE/BoJ Decisions (September 18, 2026).
Morningstar / Dow Jones Market
Data: STOXX Europe 600
Index Weekly Summary (635.45).
Investing.com & Financial
Express: Commodity
Futures (Brent Crude $100.20/bbl, Gold Spot $4,350/oz) & DXY Index Data
(100.22).
Disclaimer: The views expressed in this post are
strictly for educational and informational purposes and do not constitute
financial or investment advice. Always conduct independent research before
making market decisions. Part of the post is written with AI assistance.