Aside from
over valuation and technical break downs a major stock market top appears overdue in 2016 from the convergence of long term market cycles. Have a look at the long term 21 year stock market cycle (#stkmktcyl) that is scheduled to conclude in 2016 highlighted in
silverdoctors.com:

In addition shorter
7 year market cycles are also scheduled to resolve in 2016. The chart below from
silverdoctors.com shows a
broadening top #megaphone pattern in the S and P 500 with the S and P at the top of the pattern.With short and long market cycles both resolving in 2016, a topping process globally in risk assets is likely in the next few months with the S and P eventually migrating to the lower line of the pattern below the 650 mark:


Indicator
|
Weekly Level / Change /
Significance
|
Implication for
S & P 500
|
Implication for Nifty*
|
S & P 500
|
2092, 0.67%
|
Bullish
|
Bullish
|
Nifty
|
8519, -0.54%
|
Neutral**
|
Bearish
|
China Shanghai Index
|
3965, 5.91%
|
Bullish
|
Bullish
|
Gold
|
1113, 1.82%
|
Bullish
|
Bullish
|
WTIC Crude
|
42.74, -2.31%
|
Bearish
|
Bearish
|
Copper
|
2.34, 0.75%
|
Bullish
|
Bullish
|
Baltic Dry Index
|
1055, -12.08%
|
Bearish
|
Bearish
|
Euro
|
1.1097, 1.13%
|
Bullish
|
Bullish
|
Dollar/Yen
|
124.32, 0.09%
|
Neutral
|
Neutral
|
Dow Transports
|
8319, 0.82%
|
Bullish
|
Bullish
|
US 10 year Bond Yield
|
2.20%, 0.97%
|
Bearish
|
Bearish
|
Nyse Summation Index
|
-298, 11.96%
|
Bullish
|
Neutral
|
US Vix
|
12.83, -4.18%
|
Bullish
|
Bullish
|
20 DMA, S and P 500
|
2096, Below
|
Bearish
|
Neutral
|
50 DMA, S and P 500
|
2095, Below
|
Bearish
|
Neutral
|
200 DMA, S and P 500
|
2077, Above
|
Bullish
|
Neutral
|
20 DMA, Nifty
|
8495, Above
|
Neutral
|
Bullish
|
50 DMA, Nifty
|
8386, Above
|
Neutral
|
Bullish
|
200 DMA, Nifty
|
8449, Above
|
Neutral
|
Bullish
|
India Vix
|
16.02, 7.44%
|
Neutral
|
Bearish
|
Dollar/Rupee
|
65.12, 2.22%
|
Neutral
|
Bearish
|
|
|
|
|
Overall
|
S & P 500
|
Nifty
|
|
Bullish Indications
|
9
|
10
|
|
Bearish Indications
|
5
|
6
|
|
Outlook
|
Bullish
|
Bullish
|
|
Observation
|
The Sand P 500 was up last
week while the Nifty under performed. Indicators are bullish.
The Vix is indicating
complacency. Once again I will look
for topping action in the Nifty and the S and P 500 in the upcoming bounce.
|
|
|
On the Horizon
|
Japan GDP, US, UK and
Canada CPI, US FOMC Minutes, US PMI
|
|
|
|
|
|
|
*Nifty
|
India’s
Benchmark Stock Index
|
|
|
Raw Data
|
Courtesy
Google finance, Stock charts, Dailyfx
|
|
|
**Neutral
|
Changes
less than 0.5% are considered neutral
|
|
|
 Signals are bullish for the upcoming week. I will look for some topping action in the Nifty and the S and P 500 in the
upcoming bounce. You can check out last weeks report for a comparison. You can also check out snapshots of the S and P 500 and Nifty Indices.
Signals are bullish for the upcoming week. I will look for some topping action in the Nifty and the S and P 500 in the
upcoming bounce. You can check out last weeks report for a comparison. You can also check out snapshots of the S and P 500 and Nifty Indices.
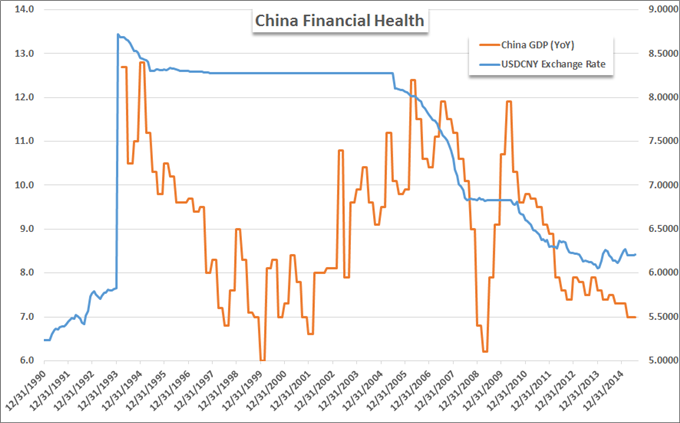
While the Chinese Yuan devaluation has taken the global markets by storm this week, it certainly is not the first of its kind and pales in comparison to the 50% devaluation in the Yuan in 1994. A very interesting chart from
dailyfx below provides insight into the fluctuations in the Yuan.

It also appears that the #Yuan is yet to catch up with the deteriorating macro economic back drop in China as per the next chart from
dailyfx and the current devaluation may not help matters in the long term.

Regardless the contagion effect on the #BRIC and other emerging economies can't be ignored as the threat of cheap Chinese exports flooding the market place is alive and well in the near term. The mere prospect of this has sent some BRIC currencies and stock markets sharply lower and this is likely to continue in the short term:


Market Insight
-
I'm Looking for 10 Readers Willing to Pony Up a Few Bucks for the
Crazy-Valuable Content Here
-
*Sound of coins rattling in a battered bowl.*
*Every Spring, I rattle the begging bowl.* (Thank you for not stepping on
my frayed robe.)
*So what's the ...
38 minutes ago
-
Revisiting Macau’s Financial Center Plan
-
While there was never an intention to replace Hong Kong, Beijing seemed to
be considering transforming Macau into a secondary offshore financial
center for...
53 minutes ago
-
-
Apple CEO Tim Cook Hints At 'Exciting' AI Developments In 2024, But Skimps
On Details: 'We Are Making Significant Investments'
-
Apple Inc. CEO Tim Cook hinted at forthcoming advancements in AI during
their Q2 2024 earnings call, emphasizing Apple's significant ongoing
investments ...
1 hour ago
-
Choreo LLC Increases Position in Marathon Petroleum Co. (NYSE:MPC)
-
Choreo LLC boosted its stake in shares of Marathon Petroleum Co. (NYSE:MPC
– Free Report) by 149.9% during the fourth quarter, Holdings Channel.com
reports...
1 hour ago
-
Signs Of The Times: War, Famine, Pestilences And Natural Disasters
-
People keep acting as if we are living in “normal” times, but the truth is
that these are not “normal” times at all. We are in the midst of a
“perfect s...
5 hours ago
-
Three Stocks: Carvana, Rivian, and Zillow
-
Three Stocks: Carvana, Rivian, and Zillow
Carvana Carvana (CVNA) stock traded 35% higher this afternoon after the
company announced earnings results that w...
6 hours ago
-
Market Talk – May 2, 2024
-
ASIA: The major Asian stock markets had a mixed day today: NIKKEI 225
decreased 37.98 points or -0.10% to 38,236.07 Shanghai closed Hang Seng
increased...
7 hours ago
-
S&P 500 PE Ratio
-
*Current S&P 500 PE Ratio:* 27.49 +0.25 (0.91%)
4:00 PM EDT, Thu May 2
7 hours ago
-
Thursday links: the return of the home page
-
Berkshire Hathaway
- 10 questions for Warren Buffett including 'Berkshire’s stock buybacks
have slowed in the past two years. Does that mean you a...
10 hours ago
-
Why the FED Should Be Already Cutting
-
The Fed held its benchmark Federal-Funds rate steady yesterday at 5.25%
– 5.5%, leaving the possibility of cuts in the future. Jerome Powell
repeated...
13 hours ago
-
Midweek Update – May 2nd 2024
-
Midweek update covering Gold, Silver, Equities (Stocks), Crude Oil, $USD
The post Midweek Update – May 2nd 2024 appeared first on The Financial Tap.
13 hours ago
-
The rise of custom software spending
-
When we think about business capital we often think about traditional
capital—physical items such as machines, desks, and cash registers. These
kinds of it...
14 hours ago
-
My No. 1 Indicator Amid Red-Hot Tech Earnings
-
Earnings reports season is here and it's coming in hot! Matt Clark is
breaking down what this means for AI and tech earnings.
The post My No. 1 Indicator...
17 hours ago
-
Daily Market Brief
-
Subscriber content. To subscribe to the Daily Market Brief please visit
Market Services on NorthmanTrader.com. The Daily Market Brief is an
in-depth market...
17 hours ago
-
Debt Rattle May 2 2024
-
Edvard Munch Separation 1896 • Student Protests Among ‘Biggest Things’ in
US in Decades – Scott Ritter (Sp.) • ‘All Because Columbia Refuses to
Divest’...
18 hours ago
-
The Kremlin's Last Warning | Martin Armstrong
-
Dmitry Konstantinovich Kiselyov (born 1954) is a major TV host, and his
latest warning to the West is to issue an ultimatum to the UK and the US.
On Russia...
23 hours ago
-
Top Tech Stocks for Buying Amid S&P 500's Surge
-
Recently released data from the personal consumption expenditures (PCE)
price index revealed that inflation increased in March. The core PCE price
index, w...
2 days ago
-
The Bank has published its annual report for the year 2023
-
2023 has been a fifth succeeding good year for Dukascopy Bank SA. The
Bank’s net profit of 2023 was CHF 1.3 million. All subsidiaries of
Dukascopy ...
3 days ago
-
Is It Time To Double Down On Precious Metals And Mining Stocks?
-
I’m more excited now about making money in the financial markets than I
have been in years, but less excited about the online internet world and
financial ...
4 days ago
-
-
Inflation Rising Right On Schedule
-
[image: global temperatures versus cpi inflation]
It makes a lot of people uncomfortable when I talk about the
interrelationships between climate data an...
6 days ago
-
Mastering Market Bottoms: 5 Signals to Spot Buying Opportunities
-
Unlock the secrets to identifying market bottoms and harness the power of
opportunity amidst market turbulence. Dive into our comprehensive guide,
packed...
1 week ago
-
Weekend Update - Trendline rejection (3/8/24)
-
SPX was rejected by the blue trendline Friday. The trendline had been
sucessfully tested four times and held since November, until now. SPX has
unable ...
1 month ago
-
Catastrophic Risk: Investing and Business Implications
-
In the context of valuing companies, and sharing those valuations, I do
get suggestions from readers on companies that I should value next. While I
d...
2 months ago
-
Hello world!
-
Welcome to WordPress. This is your first post. Edit or delete it, then
start writing!
3 months ago
-
Teaching Johns Hopkins A Privilege Lesson
-
by Not Sure01/12/24Johns Hopkins Hospital Chief Diversity Officer Sherita
Hill Golden sent a letter out essentially implying that all people who
don’t look...
3 months ago
-
Mungerisms: Timeless Wisdom from Charlie Munger on Life and Business
-
"Mungerisms" are succinct expressions of wisdom and insights coined by
Charlie Munger, the Vice Chairman of Berkshire Hathaway and Warren
Buffett's longtim...
5 months ago
-
If You Find Deer or Elk Antlers on the Ground, Leave Them There, Say Some
States
-
Even though elk do shed their antlers naturally, collecting them brings up
a number of ethical issues.
6 months ago
-
It’s Crunch Time for The Daily Doom and Doom Time for The Great Recession
Blog
-
The Great Recession Blog is officially done for good, and it remains to be
seen if all my writing continues on TheDailyDoom.com. If my writing on
economi...
9 months ago
-
Innovative Industrial Properties Stock a Great Way to Play Pot Sector
-
*IIPR Stock Represents a Long-Term Opportunity*
Marijuana stocks briefly attracted investors' attention following the 2022
mid-term elections, when Maryl...
1 year ago
-
2008 analogue
-
The 2008 analogue tape looks very interesting from where we stand.
Let's anchor it to the next two Fed meetings -- since that's all that
matters -- and i...
1 year ago
-
Back to trade with Bar Replay
-
It is often said that one should not be sad about the past, but sometimes
it can be nice to return to it. Who would like to buy Tesla for $1 and
experience...
1 year ago
-
After This Holiday Rally, You Better Know When To Walk Away
-
This week’s investor insight will make you think twice about the current
stock and bond rally as we head into the end of the year. We get a lot of
questi...
1 year ago
-
How Africa Can Escape Chronic Food Insecurity Amid Climate Change
-
The toll of extreme weather events on crops underscores the region’s
challenges and need for policies to save lives and protect livelihoods.
1 year ago
-
12 Bear Market Rules To Live By – Survive & Thrive In The Next Bear Market
-
12 Bear Market Rules To Live By – Survive & Thrive In The Next Bear Market
[image: Bear Market Rules Survival Guide]
I grew up in the 1970s-1980s when th...
1 year ago
-
Growth Companies – Getting What You Want
-
What do the growth companies in your field have in common? How are they
doing so well and what can you learn from them? Growth companies usually
make a pro...
1 year ago
-
-
Blog Post Title
-
What goes into a blog post? Helpful, industry-specific content that: 1)
gives readers a useful takeaway, and 2) shows you’re an industry expert.
Use your c...
2 years ago
-
Foot Locker Crushed Q2 Earnings Expectations Sending Stock Higher
-
Plus, AstraZeneca said its antibody therapy reduced the risk of developing
COVID-19 symptoms by 77%, The Topps Co’s SPAC merger is off, and Elon Musk
annou...
2 years ago
-
Elliott Wave Stock Market Update - July 10th
-
The market has continued its rally to higher highs and it doesn't seem like
it wants to stop. We now have a new ATH at 4371 which are NASDAQ levels
s...
2 years ago
-
The Psychology of QE is Far More Important Than the Amount of It
-
Let's discuss what QE really does vs the psychology of QE.
2 years ago
-
Hello world!
-
Welcome to WordPress. This is your first post. Edit or delete it, then
start writing!
3 years ago
-
Trading: Opportunities Are Dispersed
-
Opportunities are dispersed. You might have an... *READ THE REST OF THE
ARTICLE ON THE NEW WEBSITE: JIM ROGERS TALKS MARKETS *
*Jim Rogers is a legendary i...
3 years ago
-
Market Signals for the US stock market S and P 500 Index and Indian Stock
Market Nifty Index for the Week beginning November 09
-
Indicator Weekly Level / Change Implication for S & P 500 Implication for
Nifty* S & P 500 3509, 7.32% Bullish Bullish Nifty 12264, 5.34% Neutral **
Bullis...
3 years ago
-
-
Fully Automated Trend Trading w/ Stocks Or Options
-
There’s a lot of research to support the usage of trend indicators as
simple risk reduction elements that can be layered onto an existing
strategy. Howev...
3 years ago
-
2020 Top Investment Picks – Q3 Update
-
At the beginning of the year, I put together a list of Top Investment Picks
for 2020 from the investment community and track them on this website. This
is ...
3 years ago
-
Upside-Down Markets: Profits, Inflation and Equity Valuation in Fiscal
Policy Regimes
-
I just published a new long-form piece through OSAM entitled “Upside-Down
Markets: Profits, Inflation and Equity Valuation in Fiscal Policy Regimes.”
In th...
3 years ago
-
The last of 12326
-
February 22nd 2012.....
First post...
https://permabeardoomster.blogspot.com/2012/02/can-anyone-fly-plane.html
--
This post will be the last under the o...
3 years ago
-
-
6/7 to 10/7, 2020 Nifty & Bank Nifty, Bharat Forge, IBhasgFin & RIL.
Weekly futures Pr...
3 years ago
-
Ultramarathoner Runs Over 200 Miles in Backyard, Wins Golden Toilet Paper
Roll
-
Strange times indeed. In the land “BC,” before coronavirus, people ran long
distances in foot races, and toilet paper wasn’t coveted. Things have
changed. ...
4 years ago
-
One Year Later
-
A year ago today I lost my father and my best friend, everyone here lost
their mentor and a friend. Dad and I spent the last 7 years of his life
living tog...
4 years ago
-
-
Advanced Micro Devices (AMD) Retreating Towards Key Support Around
$25.60-$27
-
AMD has failed to clear the
2018 high around $34.20. It is retreating, and has broken an
August/September sup...
4 years ago
-
Advanced Search is Now on Stocktwits
-
Advanced Search Is Now on Stocktwits
Come rain or shine, the Stocktwits community shares over 200,000 messages
per day. That includes charts, news, trade i...
4 years ago
-
Nightly Algo Report – December 6, 2018
-
To access this post, you must purchase Premium Plan or Premium Plan -
Annual.
The post Nightly Algo Report – December 6, 2018 appeared first on
Elliottwa...
5 years ago
-
Don’t be Fooled by the Pullback in the Dollar Because….
-
Don’t be fooled by the pullback in the U.S. dollar today because the
greenback could still strengthen further before the end of the year. Nearly
all of the...
5 years ago
-
A look at the bull market ahead
-
My latest missive on the near-term stock market outlook can be seen at
Financial Sense web site. You can see it by clicking on the following link:
https:/...
6 years ago
-
Weekly Videos
-
This week’s video will be posted on the new home for Short Takes. If all
goes well, it will appear sometime between 6:00 and 8:00 pm ET.
6 years ago
-
Gold Miners near a buy zone
-
Gold cleared a several month long consolidation a few weeks ago as it
cleared $1300, and has since been consolidating as it drifts back to […]
The post G...
6 years ago
-
Current Account Deficits and Safe Assets
-
The International Monetary Fund has issued its External Sector Report for
2017, and among its key findings: “Global current account imbalances were
broadly...
6 years ago
-
Kafka For The Twenty First Century
-
I've been spending a slightly frustrating day trying to update my payment
details at google. To log in to my admin console I need to log in using my
G Sui...
7 years ago
-
Gold Unleashed by Fed
-
Gold's next major upleg was likely unleashed by a very-dovish FOMC this
week, which now has its hands tied on hiking rates or being hawkish due to
the US e...
7 years ago
-
August 24th Blogger Sentiment Poll
-
There are more bulls than bears in this week's poll. Blogger Sentiment Poll
Participants: 24/7 Wall St (N) Carl Futia (+) Dash of Insight (+) Elliot
Wave L...
14 years ago
My Favorite Books
- The Intelligent Investor
- Liars Poker
- One up on Wall Street
- Beating the Street
- Remniscience of a stock operator
India Market Insight
-
Nifty Forms Double Top,02 May 2024 Trade Plan
-
Foreign Institutional Investors (FIIs) displayed a Bullish approach in the
Nifty Index Futures market by Buying 29552 contracts worth 1684 crores,
result...
1 day ago
-
Tata Elxsi Q4 net profit, revenue decline QoQ; firm declares dividend of Rs
70 per share
-
[image: Tata Elxsi Q4 net profit, revenue decline QoQ; firm declares
dividend of Rs 70 per share] The net profit was down 4.6 percent
quarter-on-quarter co...
1 week ago
-
Rupee falls 29 paise to close at 82.68 against US dollar
-
During the day, the rupee touched a high of 82.45 and a low of 82.68
against the greenback. On Friday, the rupee had settled at 82.39 against
the dollar.
10 months ago
-
-
ES Hourly cloud and 4 Hour chart
-
- ES Hour moving towards the hourly cloud which may act as resistance.
- 4 Hour chart shows a possible bullish candle which may give new high's
...
2 years ago
-
JUST NIFTY BLOG 10-01-2020
-
Bulk Deals FII DII Stats Date # of Deals Total Volume (In Millions)
01-01-1970 0 0.00 Click here to see all Bulk Deals Date Category Buy Amount
(Rs. Cror...
4 years ago
-
Vist Note on Federal Bank
-
We recently met the senior management of Federal Bank which is one of the
old private sector banks with a distribution network of 1252 branches (48%
Kerala...
6 years ago
-
Nifty Bulls bounces ferociously holding 9930,EOD Analysis
-
FII's bought 4.8 K contract of Index Future worth 262 cores ,9.7 K Long
contract were added by FII's and 4.8 K Short contracts were added by FII's.
Net Ope...
6 years ago
-
Midcap & Smallcap Index Corrects, Lets Come Back To Fundamentals Again
-
Midcap Index had made a high of 18511 on 16th May 2017, fell almost 7% and
is currently trading at 17230. Smallcap Index made all time high of 7679 on
11th...
6 years ago
-
Market outlook for 30/10/2016
-
*Nifty closed up 22.75 points (0.26%) at 8638.00* while Future closed at
8667.40, premium of 29.40 points.
*Bank Nifty closed up 41.35 points (0.21%) at 19...
7 years ago
-
Option Open Interest for 28-10-2016
-
Inference The index opened flat to positive and after making an initial low
around 8581 saw some short covering to close at 8638.00, gain of 22.75
points. ...
7 years ago
-
Market Review for 23rd August 2016
-
*Nifty (8629)* we said ‘technically trend is still intact but there exists
selling pressure near 8746 and support around 8600 zones’ the Nifty
unfolded as...
7 years ago
-
ITC To Resume Cigarette Manufacturing
-
ITC manufactures a range of cigarette brands, including India Kings,
Classic, Gold Flake, Navy Cut, Capstan, Bristol, Flake, Silk Cut, which are
manufactur...
8 years ago
-
My Asset Allocation Strategy (Indian Market)
Cash - 40%
Bonds - 20%
Fixed deposit - 20%
Gold - 5%
Stocks - 10% ( Majority of this in dividend funds)
Other Asset Classes - 5%
My belief is that stocks are relatively overvalued compared to bonds and attractive buying opportunities can come along after 1-2 years. In a deflationary scenario no asset class does well other than U.S bonds, the U.S dollar and the Japanese yen, so better to be safe than sorry with high quality government bonds and fixed deposits. Cash is the king always. Of course this varies with the person's age.