
Global equity markets enter the final trading week of Q3 2026 amid a volatile shift in macroeconomic conditions. Rising US Treasury yields, persistent geopolitical tensions in the Middle East, and elevated energy prices are testing the resilience of major asset classes. Following the Federal Reserve's monetary policy adjustments earlier this month, investor focus has shifted from rate-cut expectations toward sovereign yield dynamics and corporate earnings persistence.
1.
Global Macro & Fundamentals
Interest
Rates & Sovereign Yields
- United States: The US 10-Year Treasury Yield surged toward 5.21%, reaching multi-month highs. Higher-yield benchmarks continue to exert discount-rate pressure on tech valuation multiples and capital-intensive equities.
- Europe & UK: European benchmark sovereign yields moved higher in tandem with US Treasuries as central bank speakers emphasized a data-dependent, cautious stance on monetary easing.
- Japan: The Bank of Japan maintains strict
yield curve control adjustments amid persistent domestic wage inflation
and ongoing pressure on the Japanese Yen.
Exchange
Rates & FX Dynamics
- US Dollar Index (DXY): Rallied past key horizontal support zones around 100.46, holding near 101.52 as global capital flows back into high-yielding USD assets.
- EUR/USD & GBP/USD: Under fundamental pressure due to
widening yield differentials against US rates and elevated imported energy
costs.
Commodity
Markets
- Brent Crude Oil: Trading above key support at $96.15/bbl, tested upside resistance toward $100.00+ driven by ongoing Middle Eastern supply disruptions and OPEC+ output constraints.
- Gold (XAU/USD): Sustaining strong structural bid levels above $4,282/oz (spot
benchmark) as safe-haven demand offsets headwinds from high nominal
yields.
2.
Valuations & Earnings Expectations
- S&P 500 Forward P/E: Broad market forward multiples remain elevated around 21.5x to 22.0x, leaving small margin for earnings misses as Q3 earnings season approaches.
- Market Breadth & Concentration: Equity gains remain
disproportionately driven by mega-cap technology and energy majors, while
small-cap (Russell 2000) and high-debt balance sheets face tighter credit
conditions.
3.
Technical Framework & Key Levels
|
|
|
|
|
|
|
S&P 500 |
~7,617 – 7,650 |
7,617.43 |
7,825.30 |
Neutral /
Tactical Retest |
|
US 10-Year Yield |
5.215% |
4.95% |
5.24% |
Bullish Yield
Trend |
|
US Dollar Index (DXY) |
101.52 |
100.46 |
103.22 |
Bullish
Momentum |
|
Brent Crude Oil |
$96.15/bbl |
$96.15 |
$106.40 |
Bullish /
Supply Squeeze |
|
Gold (Spot) |
$4,282.50/oz |
$4,282.51 |
$4,510.84 |
Bullish /
Safe-Haven Bid |
4. Geopolitics & Tactical Outlook
Global Market Snapshot
|
Asset Class |
Weekly
Level / Change |
Implications
for S&P 500 |
Implications for Nifty* |
|
S&P
500 |
7743, 1.21% |
Bullish |
Bullish |
|
Nifty |
23141, -0.88% |
Neutral
** |
Bearish |
|
China
Shanghai Index |
3888, -0.60% |
Bearish |
Bearish |
|
Gold |
4321, -2.36% |
Bearish |
Bearish |
|
WTIC
Crude |
92.44, -3.79% |
Bearish |
Bearish |
|
Copper |
6.78, 1.32% |
Bullish |
Bullish |
|
CRB Index |
419, -0.95% |
Bearish |
Bearish |
|
Baltic
Dry Index |
3426, 1.66% |
Bullish |
Bullish |
|
Euro |
1.1391, -0.81% |
Bearish |
Bearish |
|
Dollar/Yen |
157.29, 0.25% |
Neutral |
Neutral |
|
Dow
Transports |
19572, -2.52% |
Bearish |
Neutral |
|
Corporate
Bonds (ETF) |
103.21, -1.42% |
Bearish |
Bearish |
|
High-Yield
Bonds (ETF) |
93.61, -0.99% |
Bearish |
Bearish |
|
US
10-year Bond Yield |
5.17%, 3.42% |
Bearish |
Bearish |
|
NYSE
Summation Index |
-559, -52.00% |
Bearish |
Neutral |
|
US Vix |
14.87, 0.41% |
Neutral |
Neutral |
|
S&P
500 Skew |
145 |
Bearish |
Neutral |
|
CNN Fear
& Greed Index |
Fear |
Bullish |
Neutral |
|
Nifty MMI
Index |
Extreme Fear |
Neutral |
Bullish |
|
20 DMA,
S&P 500 |
7673, Above |
Bullish |
Neutral |
|
50 DMA,
S&P 500 |
7636, Above |
Bullish |
Neutral |
|
200 DMA,
S&P 500 |
7205,
Above |
Bullish |
Neutral |
|
20 DMA,
Nifty |
23553, Below |
Neutral |
Bearish |
|
50 DMA,
Nifty |
23995, Below |
Neutral |
Bearish |
|
200 DMA,
Nifty |
24423,
Below |
Neutral |
Bearish |
|
S&P
500 P/E |
26.40 |
Bearish |
Neutral |
|
Nifty P/E |
19.56 |
Neutral |
Neutral |
|
India Vix |
12.16, 6.81% |
Neutral |
Bearish |
|
Dollar/Rupee |
95.89, -0.05% |
Neutral |
Neutral |
|
Overall |
S&P
500 |
Nifty |
|
|
Bullish
Indications |
7 |
4 |
|
|
Bearish
Indications |
12 |
13 |
|
|
Outlook |
Bearish |
Bearish |
|
|
Observation |
The
S&P500 rose, and the Nifty fell last week. Indicators are bearish for the
week. Markets are topping. Watch those stops. An oversold bounce first. |
||
|
On the
Horizon |
UK – GDP, US – GDP, Employment data |
||
|
*Nifty |
India’s
Benchmark Stock Market Index |
||
|
Raw Data |
Data
courtesy stockcharts.com, investing.com, multpl.com, nseindia.com,
tickertape.in, forexfactory.com |
||
|
**Neutral |
Changes
less than 0.5% are considered neutral |

The past week saw US equity
markets rise. Most emerging markets rose amid rising interest rates. Transports
fell. The Baltic Dry rose. The dollar rose. Most commodities fell. Valuations
are expensive, market breadth fell, and sentiment is fearful. Volatility
(S&P 500) was unchanged. The market is forming an important top and getting
ready for the September/October swoon, but first, an oversold bounce that
started may result in nominal divergent highs.
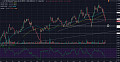
The critical levels to watch for
the week are 7755 (up) and 7730 (down) on the S&P 500 and 23250 (up) and 23050
(down) on the Nifty. A significant breach of the
above levels could trigger the next major move in these markets. High
beta/P/E will get torched again and is a sell on every rise. Gold
increasingly looks like the asset class to own over the next decade. Gold
exploded, rising almost eightfold over the decade following the dot-com bust in
2000. Imagine what would happen to gold when this AI bubble bursts. You
can check out last week’s report for a comparison. I love your thoughts and
feedback.
About the Author
Dr. Rajveer S. Rawlin holds a PhD and an MBA in Finance and serves
as an Associate Professor at CHRIST University. He has tracked capital markets
in both the US and India since 1993, specializing in macroeconomic cycles,
banking profitability metrics, and econometric investment analysis.
References
& Sources
· Ahead of the Curve Blog – Rajveer's Market Views
(September 2026 Reports). URL: (http://rajveersmarketviews.blogspot.com/)
· United States 10-Year Bond Yield Historical Data
(September 28, 2026). Investing.com.
· Global Market Report: Brent Crude, Gold, and Dollar Index
Analysis (September 25, 2026). ThinkMarkets News & Analysis.
· Saxo Markets Macro & Options Briefing (September
2026). Saxo Bank Research.
· Forex & Economic Calendar Overview (Week of Sept 28 –
Oct 4, 2026). LiteFinance / Vantage Markets.
Disclaimer: The views expressed in this post are
strictly for educational and informational purposes and do not constitute
financial or investment advice. Always conduct independent research before
making market decisions. Part of the post is written with AI assistance.










No comments:
Post a Comment