

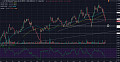
The Chart of the day is via Chris Vermeulen from the goldandoilguy.com and shows a comparison of the price performance of Lehman Brothers in 2008 to the current price performance of Deutsche Bank today. With a number of European and US banks having similar charts to Deutsche Bank and the bank index not confirming recent new highs in the broader market, once can all but wonder if a repeat of 2008 is on the cards:










No comments:
Post a Comment