
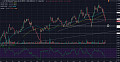
The chart of the day is from TheWaveTrading via SafeHaven and shows the 10 month moving average (MMA) crossing below the 20 MMA for the S and P 500 after 8 years. Long term moving average crosses are usually associated with trend changes as was the case with the S and P 500 in 2000 and 2008:










No comments:
Post a Comment