The chart of the day is courtesy of Econmatters that shows bear market probabilities for the US stock market S & P 500 Index. The chart shows that despite the recent rally, the probability of a bear market is still pretty high:


Ahead of the Curve provides you with analysis and insight into today's global financial markets. The latest news and views from global stock, bond, commodity and FOREX markets are discussed.
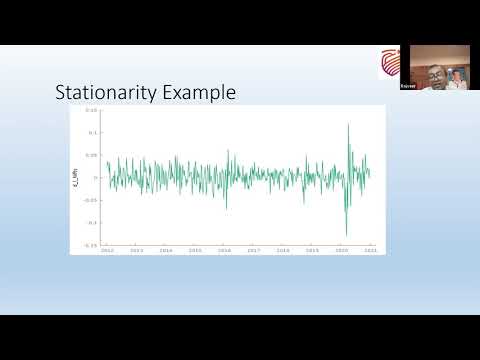
This video shows key time-series analyses techniques such as ARIMA, Granger Causality, Co-integration, and VECM performed via GRETL. Key dia...




GW Pharmaceuticals $GWPH has been retreating sharply, and might have further downside towards $100.
G...





No comments:
Post a Comment