Here is the daily Forex report from the currency strategists at dailyfx.
The report looks at the fundamentals and technicals of key forex pairs
along with a coverage of the key economic news of the day:

Ahead of the Curve provides you with analysis and insight into today's global financial markets. The latest news and views from global stock, bond, commodity and FOREX markets are discussed.
Featured post
Time Series Analysis with GRETL
This video shows key time-series analyses techniques such as ARIMA, Granger Causality, Co-integration, and VECM performed via GRETL. Key dia...

Thursday, 4 August 2016
Wednesday, 3 August 2016
Daily Forex Report
Here is the daily Forex report from the currency strategists at dailyfx. The report looks at the fundamentals and technicals of key forex pairs along with a coverage of the key economic news of the day:
Tuesday, 2 August 2016
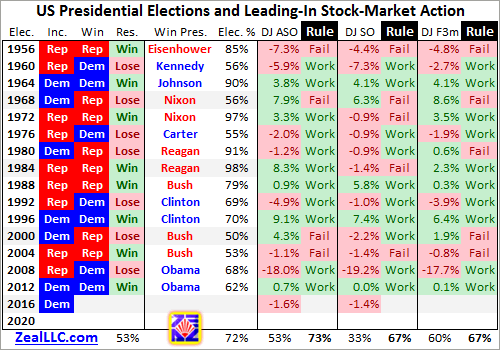
Chart of the Week - Stock Returns from August to October Forecast U.S President
The chart of the week comes from LPL Financial Research and shows that stock market performance in the August-October period has an uncanny ability to determine the winner of the U.S presidential race. A strong performance has often favored the incumbent while negative returns favor the challenger as can be seen below:

As things stand it is not looking good for the democrats as per the info-graphic below from
Adam Hamilton of Zeal LLC:
As things stand it is not looking good for the democrats as per the info-graphic below from
Adam Hamilton of Zeal LLC:
Subscribe to:
Comments (Atom)
Market Insight
-
-
Anthony Scaramucci Wants Young People To Read This 1926 Classic For Financial Discipline And Wealth Building 'Really Helped Me Get Started' - *Anthony Scaramucci,* founder of global investment firm *SkyBridge Capital,* recommended on Wednesday the century-old book “The Richest Man in Babylon” ...4 hours ago
-
The Rise of AI in Payments Is Not About Convenience - Visa has just unveiled a new suite of artificial intelligence tools designed to overhaul how credit card disputes are handled, and once again this is being...6 hours ago
-
College Graduates Are Losing the Clone War - *College grads, it may be time for different approach, not just in getting a job but in life. * *If we scrape away the hype and the humbug, this is the co...13 hours ago
-
S&P 500 PE Ratio - *Current S&P 500 PE Ratio:* 30.16 +0.24 (0.81%) 4:00 PM EDT, Wed Apr 1514 hours ago
-
Midweek Update – April 15th - Weekly report covering Gold, Equities, Crude, Dollar. A look at trade opportunities and covering the model portfolio. The post Midweek Update – April 15t...16 hours ago
-
70 Percent Of U.S. Farmers Say That They Will Not Be Able To Purchase All The Fertilizer That They Need In 2026 - We might want to listen to what the farmers are telling us, because if they don’t grow our food we do not eat. Coming into this year, we were already fac...16 hours ago
-
Wednesday links: wild visions of the future - Markets - How volatile has 2026 been so far? (morningstar.com) - History tell us volatility is a feature of financial markets. Act accordingly....17 hours ago
-
TurboTax Actually Still Has a Free Edition — But It’s Very Limited - While TurboTax opted out of the Free File Program, which is a partnership between the IRS and tax preparers, it still offers a free filing service.17 hours ago
-
The AI Trade Is Evolving - The most crowded trade on Wall Street just got a lot cheaper. For the better part of two years, tech investors were paying nose-bleed prices — forward pr...
 20 hours ago
 -
Debt Rattle April 15 2026 - Thomas Cole The Course of Empire – Destruction 1836 • Over 20 US-Approved Ships Pass Through Hormuz (ZH) • U.S. Says Israel and Lebanon Agree to More Pea...1 day ago
-
Transcript: Mike Pyle, BlackRock’s Portfolio Management Group - The transcript from this week’s, MiB: Mike Pyle, BlackRock’s Portfolio Management Group, is below. You can stream and download our full conversation,...1 day ago
-
Send the Kush | Jeremy Newberger - » He knows how to make good deals. Send the Kush. « » He'll get little. The rest he'll steal. « Jeremy Newberger, April 13, 2026. The Antichrist in the...
 2 days ago
 -
Real GDP growth by state: Fourth quarter 2025 - On April 9, 2026, the Bureau of Economic Analysis released real GDP data for all US states for the fourth quarter and annualized for 2025. The FRED map abo...2 days ago
-
Stock Market Matching The Year Ago Pattern - [image: sp500 2026 vs 2025] Several analysts I respect have noted that the price structure in 2026 is looking a lot like that of 2025. This week's chart...6 days ago
-
Easter weekend market closures 2026 - Multiple markets will be closed to celebrate Easter on Friday, 3rd of April and Monday, 6th of April. Details of trading schedules can be found here. Pleas...2 weeks ago
-
Oil, War and the Global Economy: The Market's Narrative in March 2026 - Markets play an expectations game, and in March 2026, we saw the process play out, with all of its upsides and downsides. The month started with a war ...
 2 weeks ago
 -
Is Marvell Technology the AI Hidden Gem to Buy Now? - Marvell Technology (MRVL) stock is down 36% from its all-time high hit one year ago as concerns about competition from hyperscalers and the potential los...5 weeks ago
-
EP and Swing trading Bootcamp - February 2026 Bootcamp * Price increases to $1000 from February 05, 2026!* - Price: $800(cancellation fee $200) - Date: February 20 — 22, 2026 ...2 months ago
-
Daily Market Brief - Subscriber content. To subscribe to the Daily Market Brief please visit Market Services on NorthmanTrader.com. The Daily Market Brief is an in-depth market...3 months ago
-
Our Stock Pick Of The Month For November 2025 Is Pasofino Gold (TSX.V:VEIN) – David Skarica - Pasofino Gold: TSX.V:VEIN Our stock pick of the month for November 2025 is Pasofino Gold With gold prices skyrocketing to nearly $4,000 an ounce it is t...5 months ago
-
The 2025 Job Market For The Auto Industry - The uncertain question of today is whether it's a Buyer's Market leaning towards employers or a Seller's Market giving employees the upper-hand during job ...5 months ago
-
Ascent Group LLC Sells 3,494 Shares of iShares MSCI Emerging Markets ETF $EEM - Ascent Group LLC lessened its stake in shares of iShares MSCI Emerging Markets ETF (NYSEARCA:EEM – Free Report) by 23.4% during the second quarter, accordi...6 months ago
-
Bitcoin’s 200-Day MA Breakout: Trading Crypto in Uncertain Times - As Bitcoin breaks through critical resistance levels, seasoned traders are eyeing both opportunities and warning signs in today’s volatile crypto landsca...11 months ago
-
EV Supply Chain Play: Why Solid Power (SLDP) Could Be a Hidden Gem in Battery Tech - The electric vehicle (EV) revolution is shifting into high gear, and battery technology is at the center of it all. While traditional lithium-ion batteries...1 year ago
-
Climate Change Profiteers Reveal The Democrat Party As A Satanic Death Cult Of Morons - By Barry Ferguson12/10/24The Democrat Party in the US has devolved into a satanic death cult of morons. They not only want to destroy themselves but the re...1 year ago
-
Hello world! - Welcome to WordPress. This is your first post. Edit or delete it, then start writing!1 year ago
-
Weekend Update - Trendline rejection (3/8/24) - SPX was rejected by the blue trendline Friday. The trendline had been sucessfully tested four times and held since November, until now. SPX has unable ...
 2 years ago
 -
Mungerisms: Timeless Wisdom from Charlie Munger on Life and Business - "Mungerisms" are succinct expressions of wisdom and insights coined by Charlie Munger, the Vice Chairman of Berkshire Hathaway and Warren Buffett's longtim...2 years ago
-
It’s Crunch Time for The Daily Doom and Doom Time for The Great Recession Blog - The Great Recession Blog is officially done for good, and my writing continues on TheDailyDoom.com. This site will eventually be completely terminated. If ...2 years ago
-
Innovative Industrial Properties Stock a Great Way to Play Pot Sector - *IIPR Stock Represents a Long-Term Opportunity* Marijuana stocks briefly attracted investors' attention following the 2022 mid-term elections, when Maryl...3 years ago
-
2008 analogue - The 2008 analogue tape looks very interesting from where we stand. Let's anchor it to the next two Fed meetings -- since that's all that matters -- and i...
 3 years ago
 -
Back to trade with Bar Replay - It is often said that one should not be sad about the past, but sometimes it can be nice to return to it. Who would like to buy Tesla for $1 and experience...3 years ago
-
After This Holiday Rally, You Better Know When To Walk Away - This week’s investor insight will make you think twice about the current stock and bond rally as we head into the end of the year. We get a lot of questi...3 years ago
-
How Africa Can Escape Chronic Food Insecurity Amid Climate Change - The toll of extreme weather events on crops underscores the region’s challenges and need for policies to save lives and protect livelihoods.3 years ago
-
12 Bear Market Rules To Live By – Survive & Thrive In The Next Bear Market - 12 Bear Market Rules To Live By – Survive & Thrive In The Next Bear Market [image: Bear Market Rules Survival Guide] I grew up in the 1970s-1980s when th...3 years ago
-
Growth Companies – Getting What You Want - What do the growth companies in your field have in common? How are they doing so well and what can you learn from them? Growth companies usually make a pro...3 years ago
-
-
Blog Post Title - What goes into a blog post? Helpful, industry-specific content that: 1) gives readers a useful takeaway, and 2) shows you’re an industry expert. Use your c...4 years ago
-
Foot Locker Crushed Q2 Earnings Expectations Sending Stock Higher - Plus, AstraZeneca said its antibody therapy reduced the risk of developing COVID-19 symptoms by 77%, The Topps Co’s SPAC merger is off, and Elon Musk annou...4 years ago
-
Elliott Wave Stock Market Update - July 10th - The market has continued its rally to higher highs and it doesn't seem like it wants to stop. We now have a new ATH at 4371 which are NASDAQ levels s...
 4 years ago
 -
The Psychology of QE is Far More Important Than the Amount of It - Let's discuss what QE really does vs the psychology of QE.4 years ago
-
Hello world! - Welcome to WordPress. This is your first post. Edit or delete it, then start writing!5 years ago
-
Market Signals for the US stock market S and P 500 Index and Indian Stock Market Nifty Index for the Week beginning November 09 - Indicator Weekly Level / Change Implication for S & P 500 Implication for Nifty* S & P 500 3509, 7.32% Bullish Bullish Nifty 12264, 5.34% Neutral ** Bullis...5 years ago
-
Fully Automated Trend Trading w/ Stocks Or Options - There’s a lot of research to support the usage of trend indicators as simple risk reduction elements that can be layered onto an existing strategy. Howev...5 years ago
-
2020 Top Investment Picks – Q3 Update - At the beginning of the year, I put together a list of Top Investment Picks for 2020 from the investment community and track them on this website. This is ...5 years ago
-
The last of 12326 - February 22nd 2012..... First post... https://permabeardoomster.blogspot.com/2012/02/can-anyone-fly-plane.html -- This post will be the last under the o...
 5 years ago
 -
-
Ultramarathoner Runs Over 200 Miles in Backyard, Wins Golden Toilet Paper Roll - Strange times indeed. In the land “BC,” before coronavirus, people ran long distances in foot races, and toilet paper wasn’t coveted. Things have changed. ...6 years ago
-
March report "How Revolutions, Wars and Plagues are Harbingers of 'Great Changes' in Societies and in Economics" published. http://bit.ly/2y4LJZQ - March report "How Revolutions, Wars and Plagues are Harbingers of 'Great Changes' in Societies and in Economics" published.https://t.co/k29bzcK3DY — Marc ...6 years ago
-
Weekend Report - Weekend Report Provided by the OEW Group December 21, 2019 Last Monday started with a sharp rally on positive trade news. After closing at 3169 the previou...6 years ago
-
Financial Markets Will Move To Asia - Chicago, they invented the Soybean futures contracts. But now, China uses more soybeans than ... *READ THE REST OF THE ARTICLE ON THE NEW WEBSITE: JIM ROGE...
 6 years ago
 -
GW Pharmaceuticals (GWPH) Signals Bearish Continuation To $100 -

GW Pharmaceuticals $GWPH has been retreating sharply, and might have further downside towards $100.
G...
6 years ago -
Meet Hert Capital and How He Uses Stocktwits - On Stocktwits, HertCapital has been known for quite some time. But for those reading who haven’t had a chance to follow him, we asked him a few questions...6 years ago
-
The Earnings Mirage: Why Corporate Profits are Overstated and What it Means for Investors - I just published a new long-form piece through OSAM Research Partners entitled “The Earnings Mirage: Why Corporate Profits are Overstated and What it Means...6 years ago
-
Nightly Algo Report – December 6, 2018 - To access this post, you must purchase Premium Plan or Premium Plan - Annual. The post Nightly Algo Report – December 6, 2018 appeared first on Elliottwa...7 years ago
-
Don’t be Fooled by the Pullback in the Dollar Because…. - Don’t be fooled by the pullback in the U.S. dollar today because the greenback could still strengthen further before the end of the year. Nearly all of the...7 years ago
-
Weekly Videos - This week’s video will be posted on the new home for Short Takes. If all goes well, it will appear sometime between 6:00 and 8:00 pm ET.8 years ago
-
Gold’s silent comeback and the middle class rebound - The middle class has been stuck in a rut – psychologically if not economically – for years, and they’re not afraid to admit it. Last year’s upset victory...
 8 years ago
 -
Kafka For The Twenty First Century - I've been spending a slightly frustrating day trying to update my payment details at google. To log in to my admin console I need to log in using my G Sui...
 9 years ago
 -
The Progressive Case for Abolishing the Corporate Income Tax - Reform of the corporate income tax is shaping up to be one of the big issues facing Congress in 2017. Republicans are pushing for big cuts in the corpora...9 years ago
-
Gold Unleashed by Fed - Gold's next major upleg was likely unleashed by a very-dovish FOMC this week, which now has its hands tied on hiking rates or being hawkish due to the US e...9 years ago
-
From false moves… - One of my favorite sayings came from my trader friend Brian Shannon, who said from false moves come fast moves. I always pay attention to […] The post Fr...12 years ago
-
Why Mitt Romney Will Be The Next President - News Flash: Despite how it may look, what with Occupy Wall Street protests and Tea Party rallies, the country’s populous is not as polarized as it might se...14 years ago
-
August 24th Blogger Sentiment Poll - There are more bulls than bears in this week's poll. Blogger Sentiment Poll Participants: 24/7 Wall St (N) Carl Futia (+) Dash of Insight (+) Elliot Wave L...16 years ago

Forex Insight
-
China: Growth resilience reshapes policy outlook – Commerzbank - Read more on https://www.fxstreet.com22 minutes ago
-
Chart alert: AUD/USD 360 pips rally at risk of a minor mean reversion decline below 0.7200 before new upleg - AUD/USD has rallied nearly 360 pips from late-March lows, driven by risk-on sentiment following the US–Iran ceasefire. However, the pair is approaching key...50 minutes ago
-
GBP/USD Analysis for April 16, 2026: Uptrend Challenged by Growth Risks, Safe-Haven Flows - GBP/USD’s climb looks strong on the surface, but upcoming U.K. GDP data could put the rally at risk. At the same time, the U.S. dollar is under broad pre...5 hours ago
-
Upward Revision to Q2 GDP Aids the US Dollar’s Feeble Recovery - The second estimate of US GDP growth in Q2 saw an upward revision from 2.8% to 3%. However, US resilience has come under pressure, particularly in the labo...1 year ago
-
Don’t be Fooled by the Pullback in the Dollar Because…. - Don’t be fooled by the pullback in the U.S. dollar today because the greenback could still strengthen further before the end of the year. Nearly all of the...7 years ago
-
EUR/USD Weekly Outlook - EUR/USD's decline attempt was contained at 1.0494, above 1.0493 support and rebounded. Initial bias stays neutral this week first. On the upside, break of ...9 years ago
-
Loonie and Aussie Share Downward Bond - In yesterday’s post (Tide is Turning for the Aussie), I explained how a prevailing sense of uncertainty in the markets has manifested itself in the form of...14 years ago
India Market Insight
-
Nifty Coils in a Historic Squeeze: A Rare “NR21 Doji” on a Key Astro Date Signals an Imminent, High-Velocity Move - A Deceptive Rally: The Anatomy of a Classic Short Squeeze On April 15, 2026, the Nifty market delivered a powerful 379-point rally, giving the appearance...16 hours ago
-
Reduce Persistent Systems; target of Rs 3700: Emkay Global Financial - [image: Reduce Persistent Systems; target of Rs 3700: Emkay Global Financial] Emkay Global Financial recommended reduce rating on Persistent Systems with a...1 year ago
-
Rupee falls 29 paise to close at 82.68 against US dollar - During the day, the rupee touched a high of 82.45 and a low of 82.68 against the greenback. On Friday, the rupee had settled at 82.39 against the dollar.
 2 years ago
 -
-
JUST NIFTY BLOG 10-01-2020 - Bulk Deals FII DII Stats Date # of Deals Total Volume (In Millions) 01-01-1970 0 0.00 Click here to see all Bulk Deals Date Category Buy Amount (Rs. Cror...6 years ago
-
Gold Top down analysis. - - Updating blog after a long Gap. Longest in the last 8 years. May not be able to update regularly for 2 more months to come. - Gold bulls co...
 7 years ago
 -
Vist Note on Federal Bank - We recently met the senior management of Federal Bank which is one of the old private sector banks with a distribution network of 1252 branches (48% Kerala...8 years ago
-
Bank Nifty does Price Time Squaring and gave big move - As discussed in Last Analysis Bank Nifty gave the big move as we were expecting near turn date and also made low of 24706 near our target of 24700 and bo...8 years ago
-
Midcap & Smallcap Index Corrects, Lets Come Back To Fundamentals Again - Midcap Index had made a high of 18511 on 16th May 2017, fell almost 7% and is currently trading at 17230. Smallcap Index made all time high of 7679 on 11th...8 years ago
-
Market outlook for 28/10/2016 - *Nifty closed flat at 8615.25* while Future closed at 8655.25, premium of 40.00 points. *Bank Nifty closed up 31.00 points (0.16%) at 19514.60* while Futur...
 9 years ago
 -
Option Open Interest for 27-10-2016 - Inference The index opened flat and went down to touch the lows at 8550, but support level buying saw the index close flat at 8615.25. The broader market w...
 9 years ago
 -
NIFTY OUTLOOK FOR 22-8-16 - *Nifty (8667)* we said ‘it is quite possible that the Nifty may open again in the green but I would be cautious in the upper regions’ the Nifty opened in ...9 years ago
-
ITC To Resume Cigarette Manufacturing - ITC manufactures a range of cigarette brands, including India Kings, Classic, Gold Flake, Navy Cut, Capstan, Bristol, Flake, Silk Cut, which are manufactur...10 years ago
-