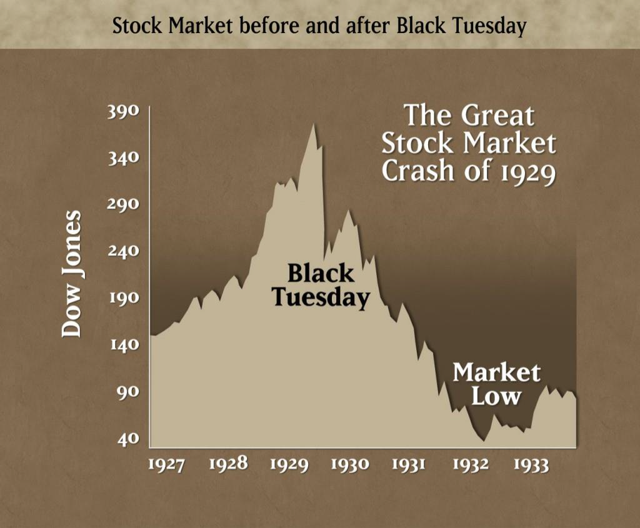
The chart of the day is courtesy MichaelMarkowski.net via Seeking Alpha and shows the stock market crash during the Great Depression of the 1930's. Are we going to have a repeat soon FED QE's not withstanding?


This video shows key time-series analyses techniques such as ARIMA, Granger Causality, Co-integration, and VECM performed via GRETL. Key dia...


|
Indicator
|
Weekly
Level / Change
|
Implication
for
S
& P 500
|
Implication
for Nifty*
|
|
S
& P 500
|
2048, -1.21%
|
Bearish
|
Bearish
|
|
Nifty
|
7555, -2.05%
|
Neutral**
|
Bearish
|
|
China
Shanghai Index
|
2985, -0.82%
|
Bearish
|
Bearish
|
|
Gold
|
1240, 1.35%
|
Bullish
|
Bullish
|
|
WTIC
Crude
|
39.66, 8.27%
|
Bullish
|
Bullish
|
|
Copper
|
2.09, -3.83%
|
Bearish
|
Bearish
|
|
Baltic
Dry Index
|
539, 19.78%
|
Bullish
|
Bullish
|
|
Euro
|
1.138, 0.19%
|
Neutral
|
Neutral
|
|
Dollar/Yen
|
108.09, -3.16%
|
Bearish
|
Bearish
|
|
Dow
Transports
|
7736, -1.92%
|
Bearish
|
Bearish
|
|
High
Yield (ETF)
|
34.14, 0.00%
|
Neutral
|
Neutral
|
|
US
10 year Bond Yield
|
1.72%, -4.02%
|
Bullish
|
Bullish
|
|
Nyse
Summation Index
|
941, -12.54%
|
Bearish
|
Neutral
|
|
US
Vix
|
15.36, 17.25%
|
Bearish
|
Bearish
|
|
20
DMA, S and P 500
|
2045, Above
|
Bullish
|
Neutral
|
|
50
DMA, S and P 500
|
1975, Above
|
Bullish
|
Neutral
|
|
200
DMA, S and P 500
|
2014, Above
|
Bullish
|
Neutral
|
|
20
DMA, Nifty
|
7611, Below
|
Neutral
|
Bearish
|
|
50
DMA, Nifty
|
7408, Above
|
Neutral
|
Bullish
|
|
200
DMA, Nifty
|
7882, Below
|
Neutral
|
Bearish
|
|
India
Vix
|
16.43, -4.89%
|
Neutral
|
Bullish
|
|
Dollar/Rupee
|
66.54, 0.47%
|
Neutral
|
Neutral
|
|
Overall
|
S
& P 500
|
Nifty
|
|
|
Bullish
Indications
|
7
|
6
|
|
|
Bearish
Indications
|
7
|
9
|
|
|
Outlook
|
Neutral
|
Bearish
|
|
|
Observation
|
The
Sand P 500 and the Nifty sold off last week. Indicators are mixed.
Markets
are back at resistance. Time to tighten those stops as downside has resumed.
|
||
|
On
the Horizon
|
China
- Financing & Loan data, CPI, GDP, Australia – Employment data, U.K –
CPI, Rate decision, U.S –Retail sales, CPI, Consumer confidence, Canada – Rate
decision
|
||
|
*Nifty
|
India’s
Benchmark Stock Market Index
|
||
|
Raw
Data
|
Courtesy
Google finance, Stock charts, FXCM
|
||
|
**Neutral
|
Changes less than 0.5% are considered
neutral
|
GW Pharmaceuticals $GWPH has been retreating sharply, and might have further downside towards $100.
G...