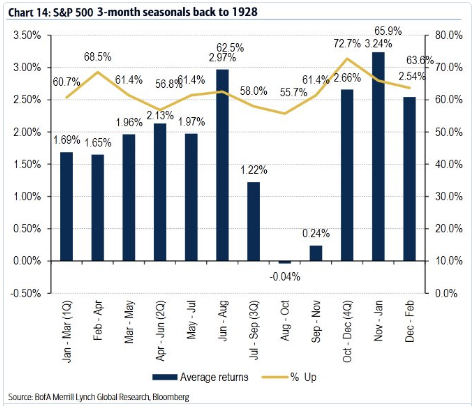
The chart of the week is from Lance Roberts via seeking alpha and shows seasonal variations in S & P 500 performance since 1928. The period between August and October is the weakest period often generating
negative returns:

negative returns:

This video shows key time-series analyses techniques such as ARIMA, Granger Causality, Co-integration, and VECM performed via GRETL. Key dia...


GW Pharmaceuticals $GWPH has been retreating sharply, and might have further downside towards $100.
G...
No comments:
Post a Comment