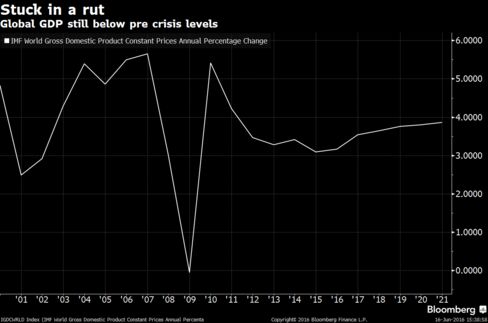
The chart of the week is courtesy of Bloomberg and shows historic and projected levels for Global GDP. Global GDP has remained below levels observed before the great recession of 2008-2009 and is expected to remain so for the foreseeable future:

This video shows key time-series analyses techniques such as ARIMA, Granger Causality, Co-integration, and VECM performed via GRETL. Key dia...
GW Pharmaceuticals $GWPH has been retreating sharply, and might have further downside towards $100.
G...
GMT-4 | Event | Actual | Consensus | ||
---|---|---|---|---|---|
Friday, May 16 | |||||
15:30 | AU | CFTC AUD NC Net Positions | $-49.3K | ||
16:00 | US | Total Net TIC Flows | $254.3B | Revised from $284.7B | |
16:00 | US | Net Long-Term TIC Flows | $161.8B | $44.2B | Revised from $112.0B |
18:00 | US | Fed's Barkin speech | |||
21:40 | US | Fed's Daly speech | |||
Sunday, May 18 | |||||
17:20 | US | Fed's Williams speech | |||
18:30 | NZ | Business NZ PSI | |||
18:45 | NZ | Producer Price Index - Output (QoQ) | 0.1% | ||
18:45 | NZ | Producer Price Index - Input (QoQ) | 0.2% | ||
19:01 | UK | Rightmove House Price Index (MoM) |
No comments:
Post a Comment