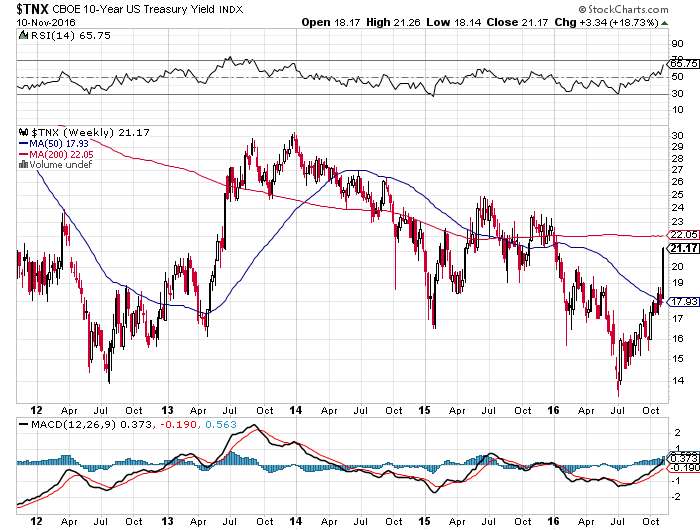
It shows bond yields breaking out of long term resistance levels. Bond yields have surged over 50 basis points this month alone. Surging bond yields are triggers for major capitol outflows from risk assets and emerging markets. Recent instances of this were the taper tantrum at the end of QE3 and the 25 basis points hike by the FED last year both of which sent global markets down well over 15%. The FED is incidentally way behind the curve here and the market has already raised rates for the FED.


No comments:
Post a Comment