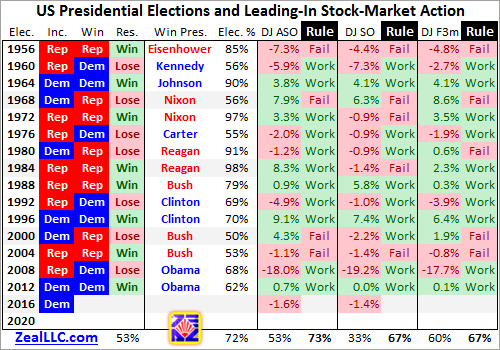
The chart of the week comes from LPL Financial Research and shows that stock market performance in the August-October period has an uncanny ability to determine the winner of the U.S presidential race. A strong performance has often favored the incumbent while negative returns favor the challenger as can be seen below:

As things stand it is not looking good for the democrats as per the info-graphic below from
Adam Hamilton of Zeal LLC:


As things stand it is not looking good for the democrats as per the info-graphic below from
Adam Hamilton of Zeal LLC:


No comments:
Post a Comment