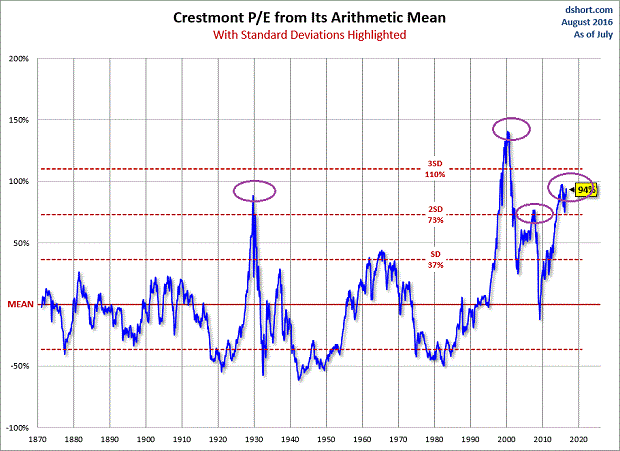
The Chart of the week is courtesy Gary Gordon via seeking alpha and shows the Cresmont P/E ratio of the S & P 500. The ratio is currently at well over 2 standard deviations over the mean much like in 1930, 2000, and 2008 when the market experienced substantial sell offs. Will it be any different this time around?


No comments:
Post a Comment